
















©The Author(s) 2026.
World J Clin Oncol. Jan 24, 2026; 17(1): 113304
Published online Jan 24, 2026. doi: 10.5306/wjco.v17.i1.113304
Published online Jan 24, 2026. doi: 10.5306/wjco.v17.i1.113304
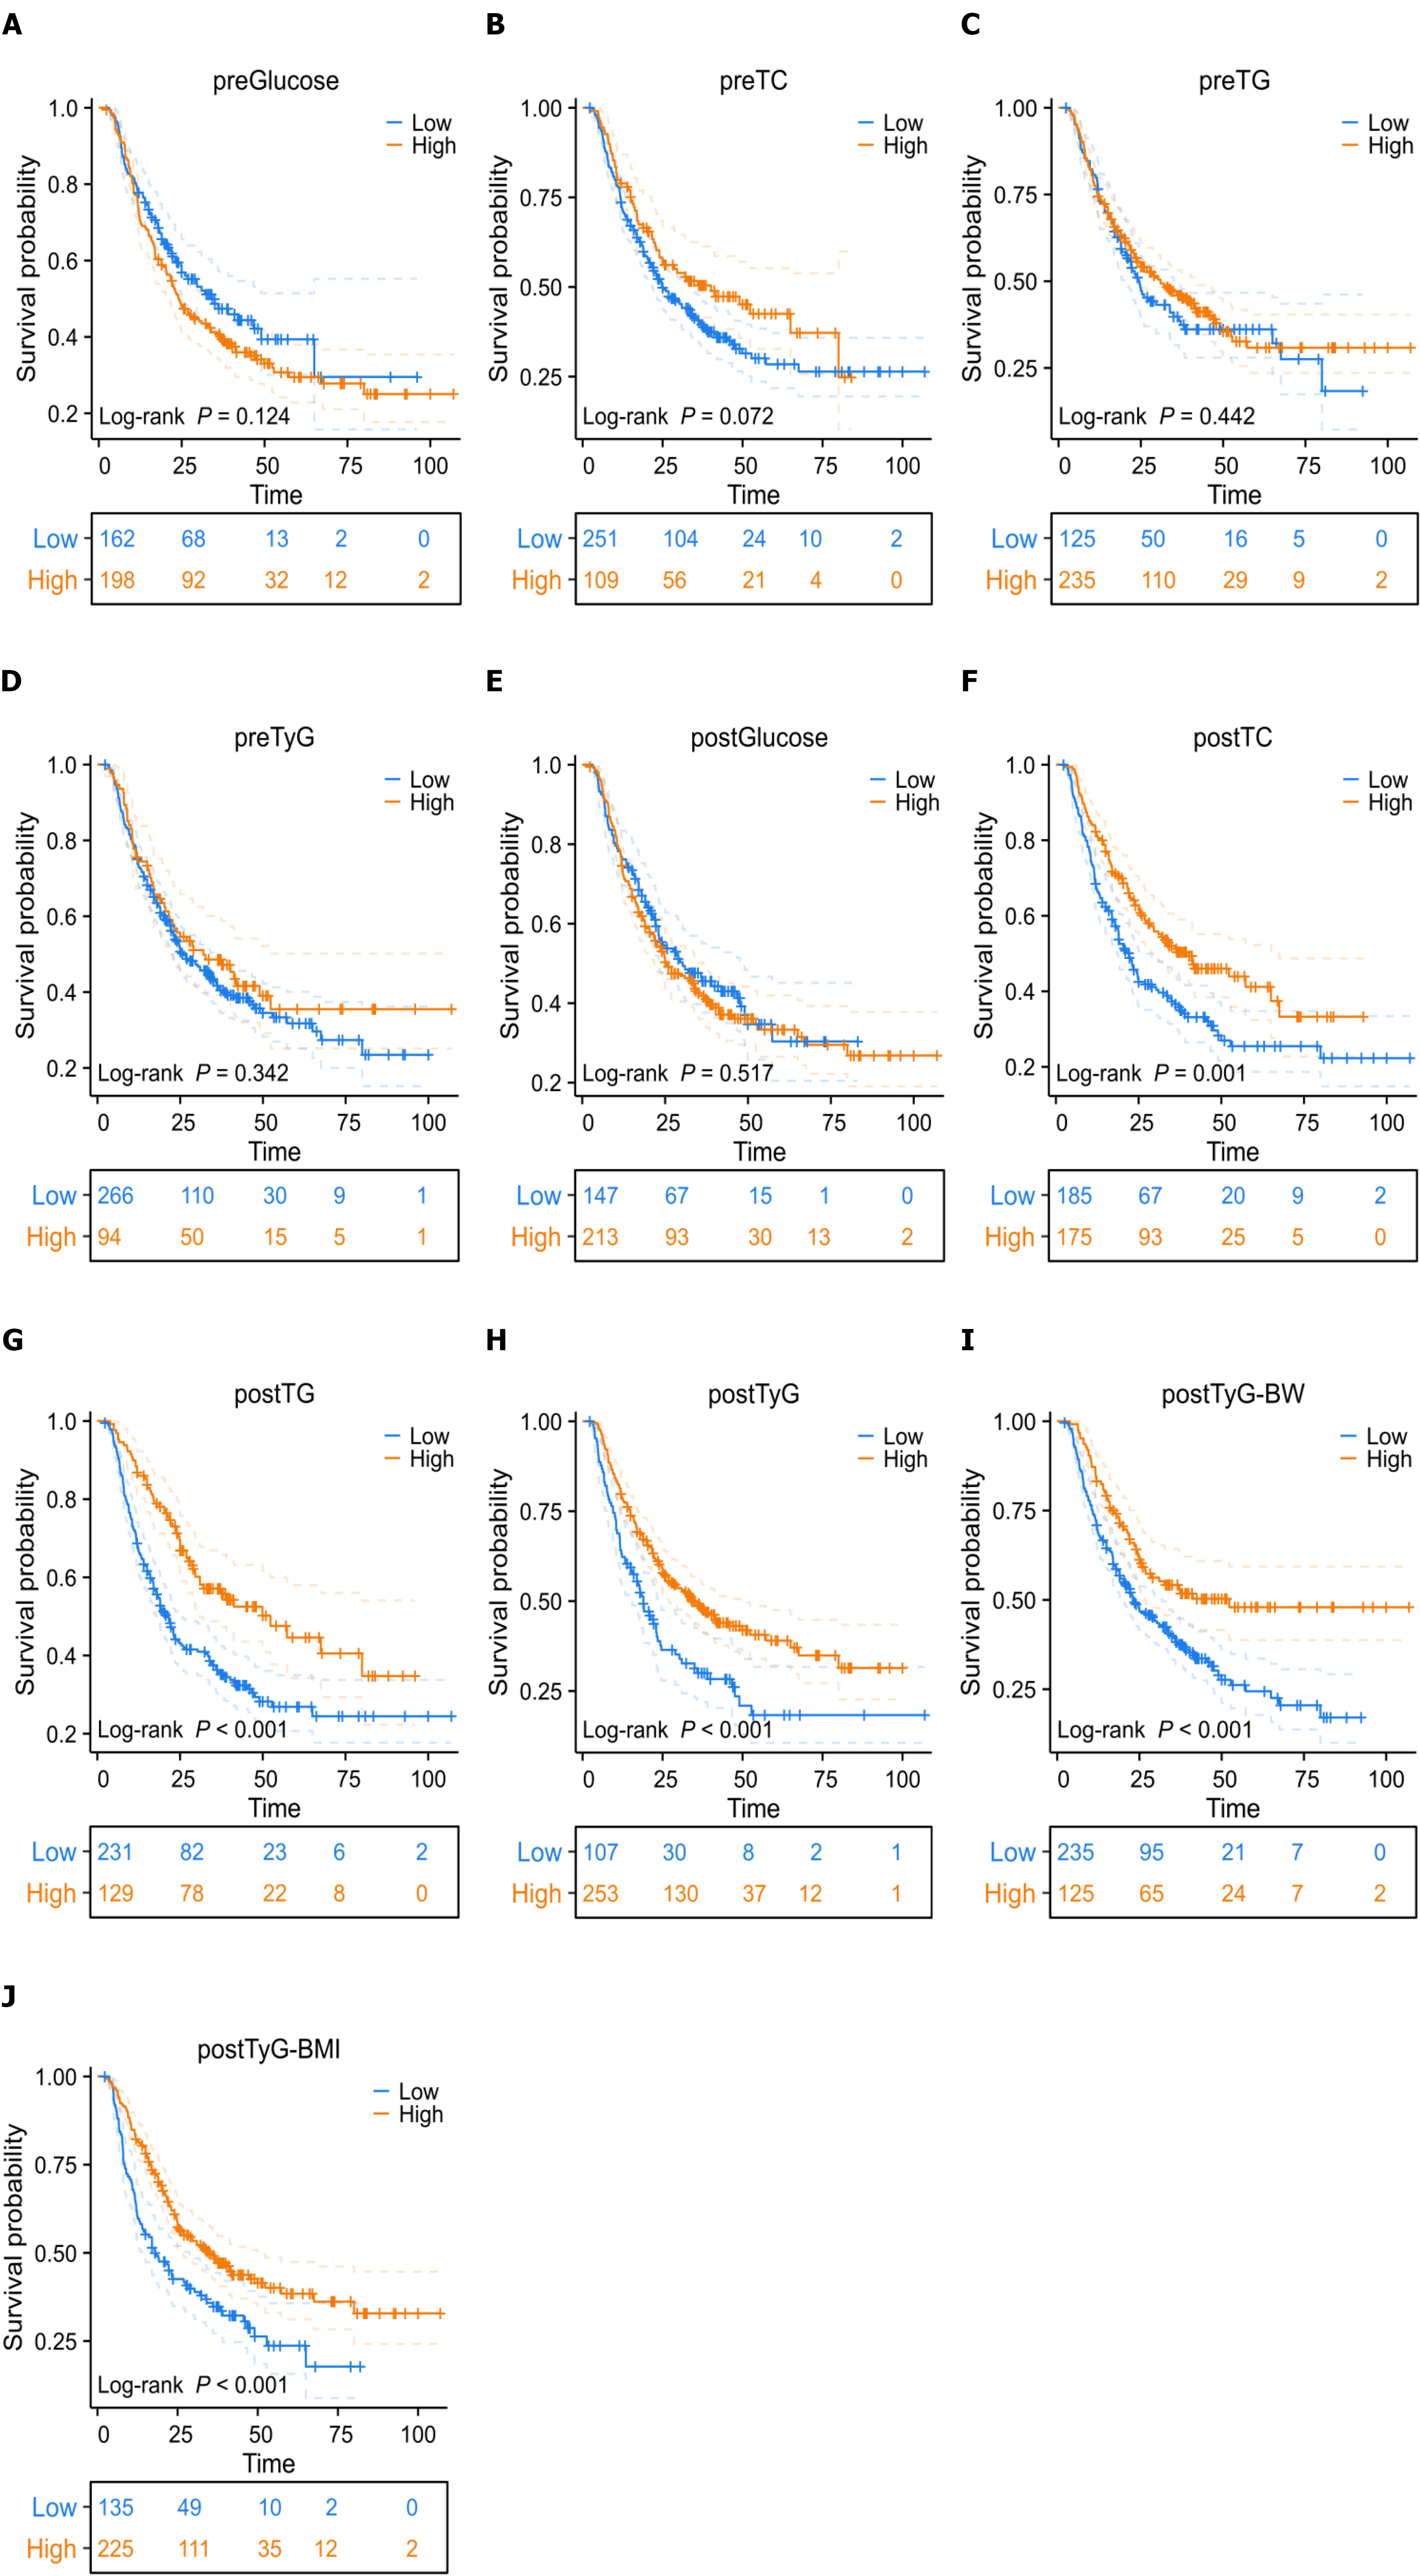
Figure 4 Kaplan-Meier survival analysis of overall survival stratified by metabolic parameters before and after treatment.
A-D: Survival curves stratified by pre-treatment glucose, pre-treatment total cholesterol, pre-treatment triglycerides, and pre-treatment triglyceride-glucose (TyG) index, respectively; E-H: Survival curves stratified by post-treatment glucose, post-treatment total cholesterol, post-treatment triglycerides, and post-treatment TyG index, respectively; I and J: Survival curves stratified by post-treatment TyG-body weight and post-treatment TyG-body mass index, respectively. preGlucose: Pre-treatment glucose; preTC: Pre-treatment total cholesterol; preTG: Pre-treatment triglycerides; preTyG: Pre-treatment triglyceride-glucose; postGlucose: Post-treatment glucose; postTC: Post-treatment total cholesterol; postTG: Post-treatment triglycerides; postTyG: Post-treatment triglyceride-glucose; postTyG-BW: Post-treatment triglyceride-glucose-body weight; postTyG-BMI: Post-treatment triglyceride-glucose-body mass index.
- Citation: Xiao L, Liu YD, Zhang X, Zhang SC, Lyu JH. Post-treatment triglyceride-glucose index as survival protective factors in patients with esophageal squamous cell carcinoma. World J Clin Oncol 2026; 17(1): 113304
- URL: https://www.wjgnet.com/2218-4333/full/v17/i1/113304.htm
- DOI: https://dx.doi.org/10.5306/wjco.v17.i1.113304