
















©The Author(s) 2026.
World J Clin Oncol. Jan 24, 2026; 17(1): 113304
Published online Jan 24, 2026. doi: 10.5306/wjco.v17.i1.113304
Published online Jan 24, 2026. doi: 10.5306/wjco.v17.i1.113304
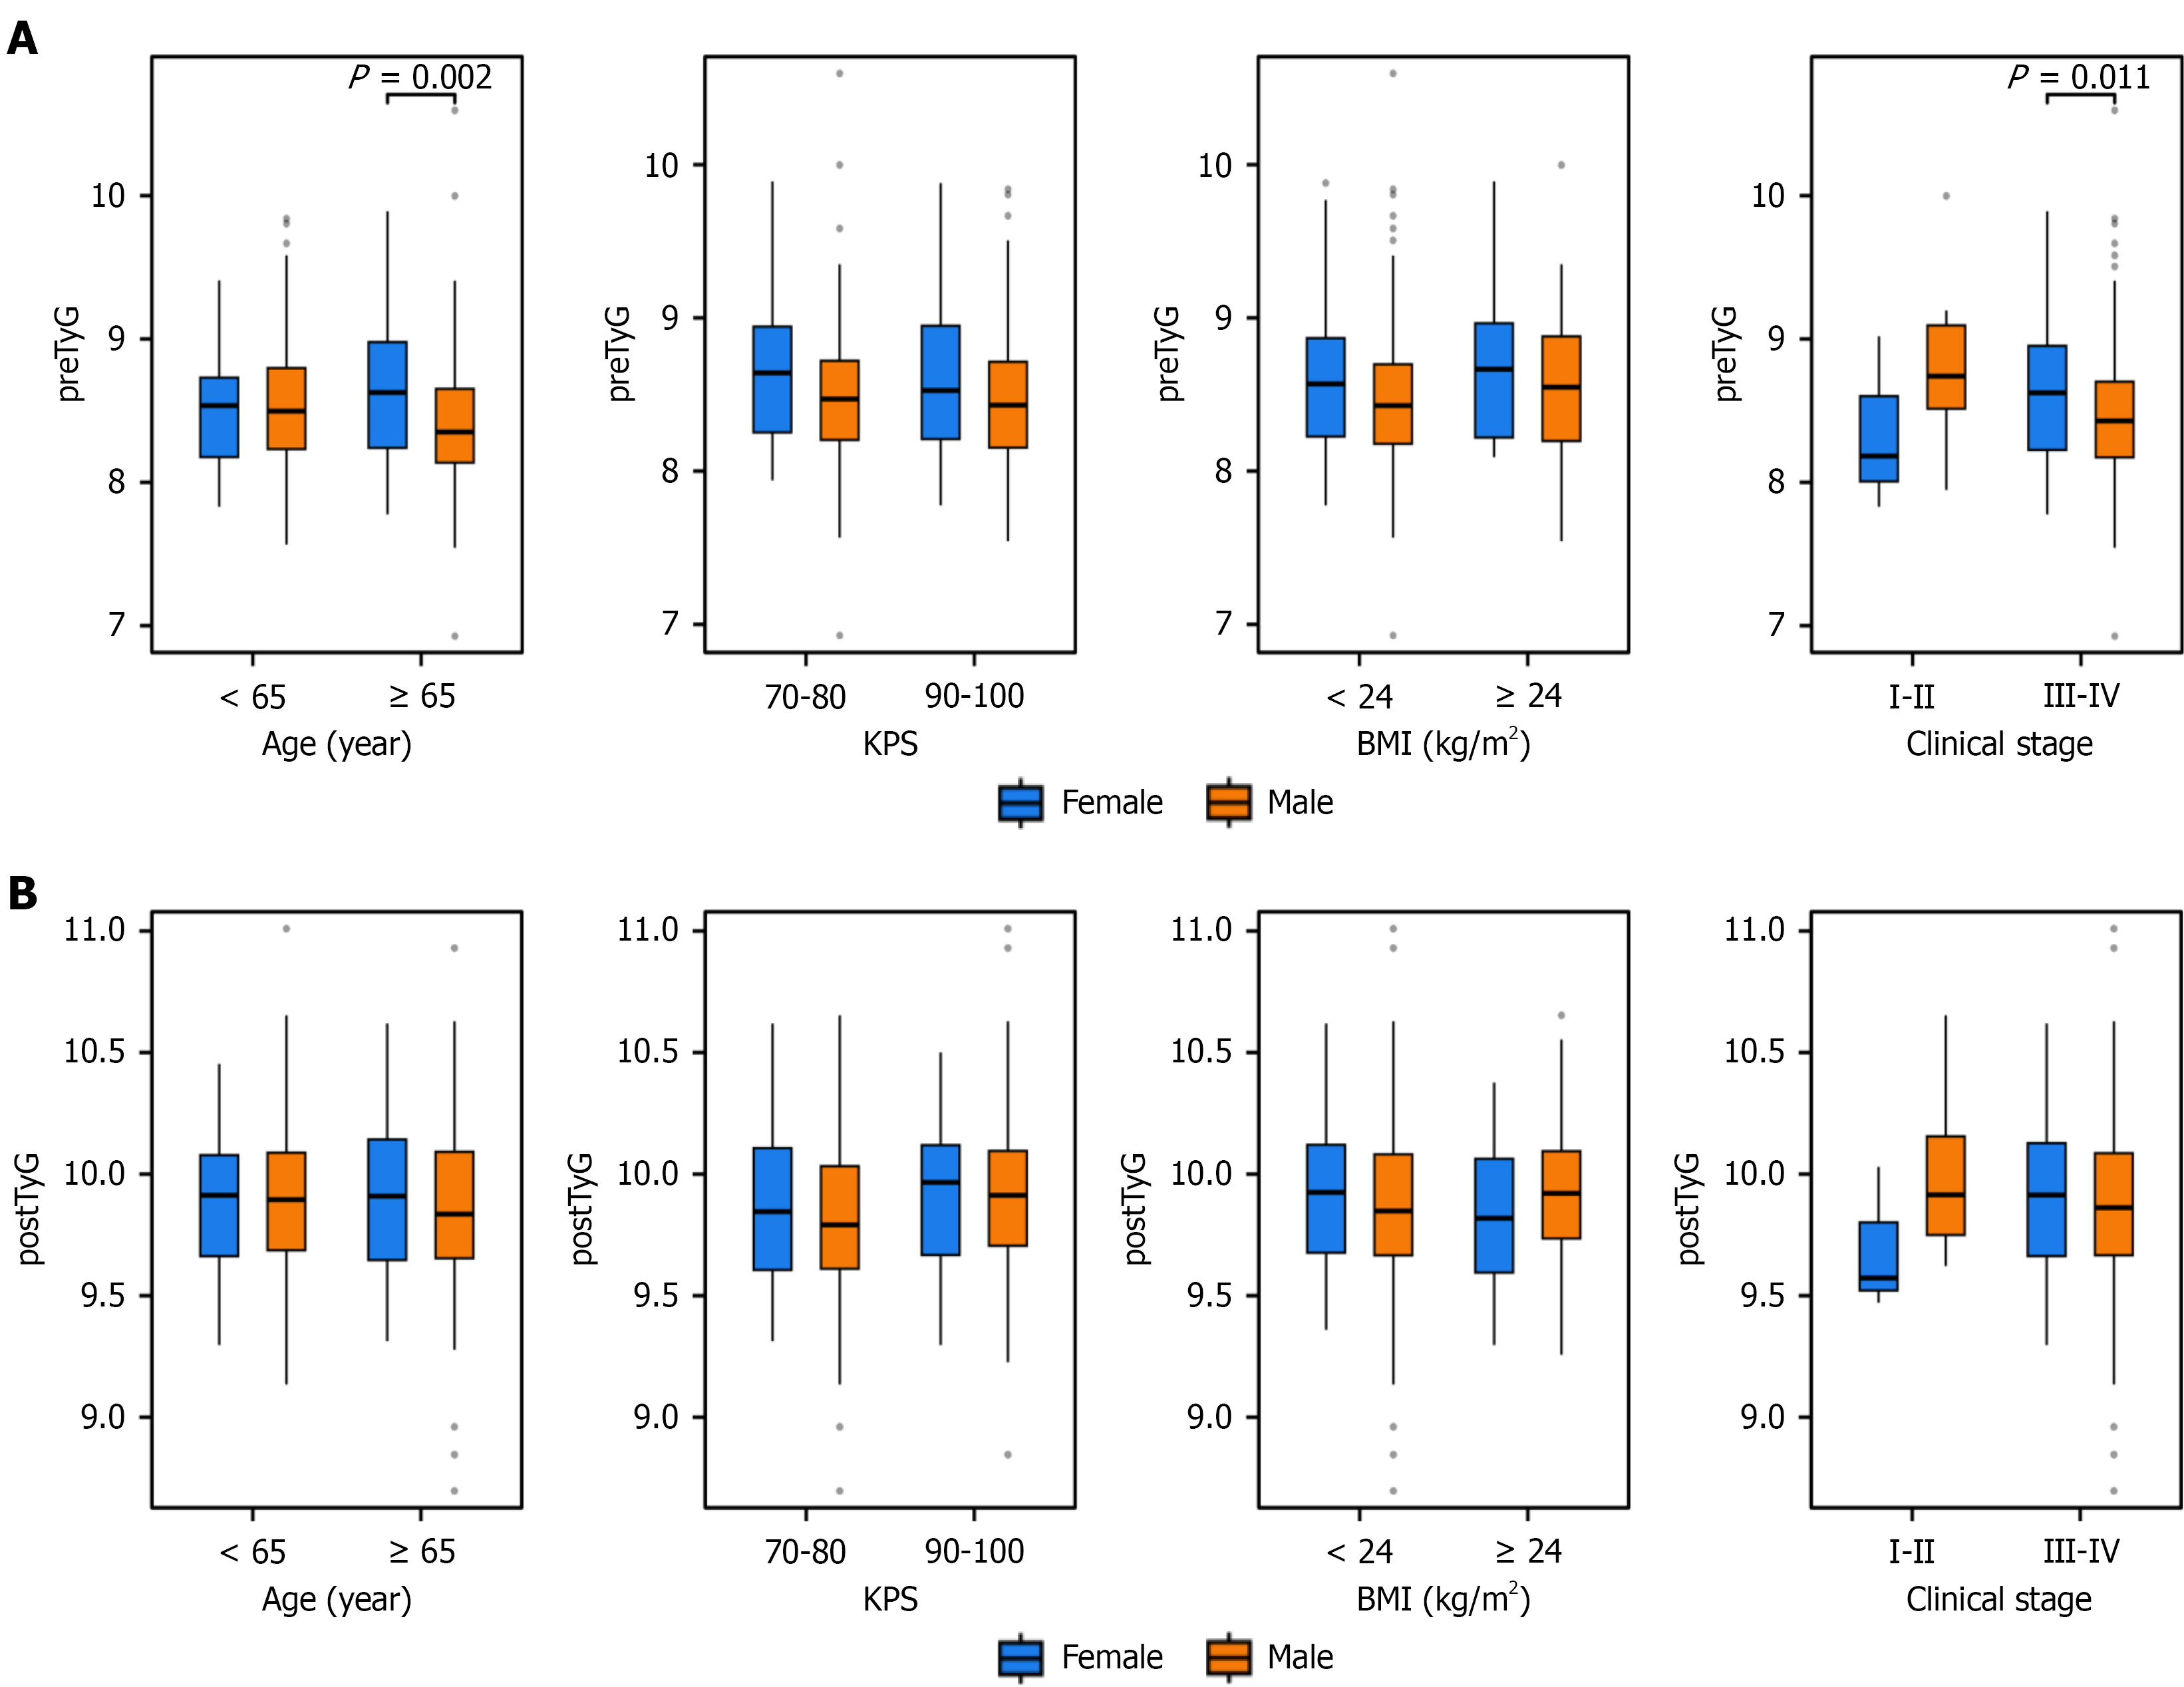
Figure 2 Distribution of triglyceride-glucose index stratified by clinical characteristics and gender.
A: Pre-treatment triglyceride-glucose index levels across subgroups defined by age (< 65 years vs ≥ 65 years), Karnofsky Performance Status (70-80 vs 90-100), body mass index (< 24 kg/m2vs ≥ 24 kg/m2), and clinical stage (I-II vs III-IV), comparing female (blue) and male (orange) patients; B: Levels across subgroups defined by age (< 65 years vs ≥ 65 years), Karnofsky Performance Status (70-80 vs 90-100), body mass index (< 24 kg/m2vs ≥ 24 kg/m2), and clinical stage (I-II vs III-IV), comparing female (blue) and male (orange) patients. KPS: Karnofsky Performance Status; BMI: Body mass index; postTyG: Post-treatment triglyceride-glucose; preTyG: Pre-treatment triglyceride-glucose.
- Citation: Xiao L, Liu YD, Zhang X, Zhang SC, Lyu JH. Post-treatment triglyceride-glucose index as survival protective factors in patients with esophageal squamous cell carcinoma. World J Clin Oncol 2026; 17(1): 113304
- URL: https://www.wjgnet.com/2218-4333/full/v17/i1/113304.htm
- DOI: https://dx.doi.org/10.5306/wjco.v17.i1.113304