
















©The Author(s) 2026.
World J Clin Oncol. Jan 24, 2026; 17(1): 113244
Published online Jan 24, 2026. doi: 10.5306/wjco.v17.i1.113244
Published online Jan 24, 2026. doi: 10.5306/wjco.v17.i1.113244
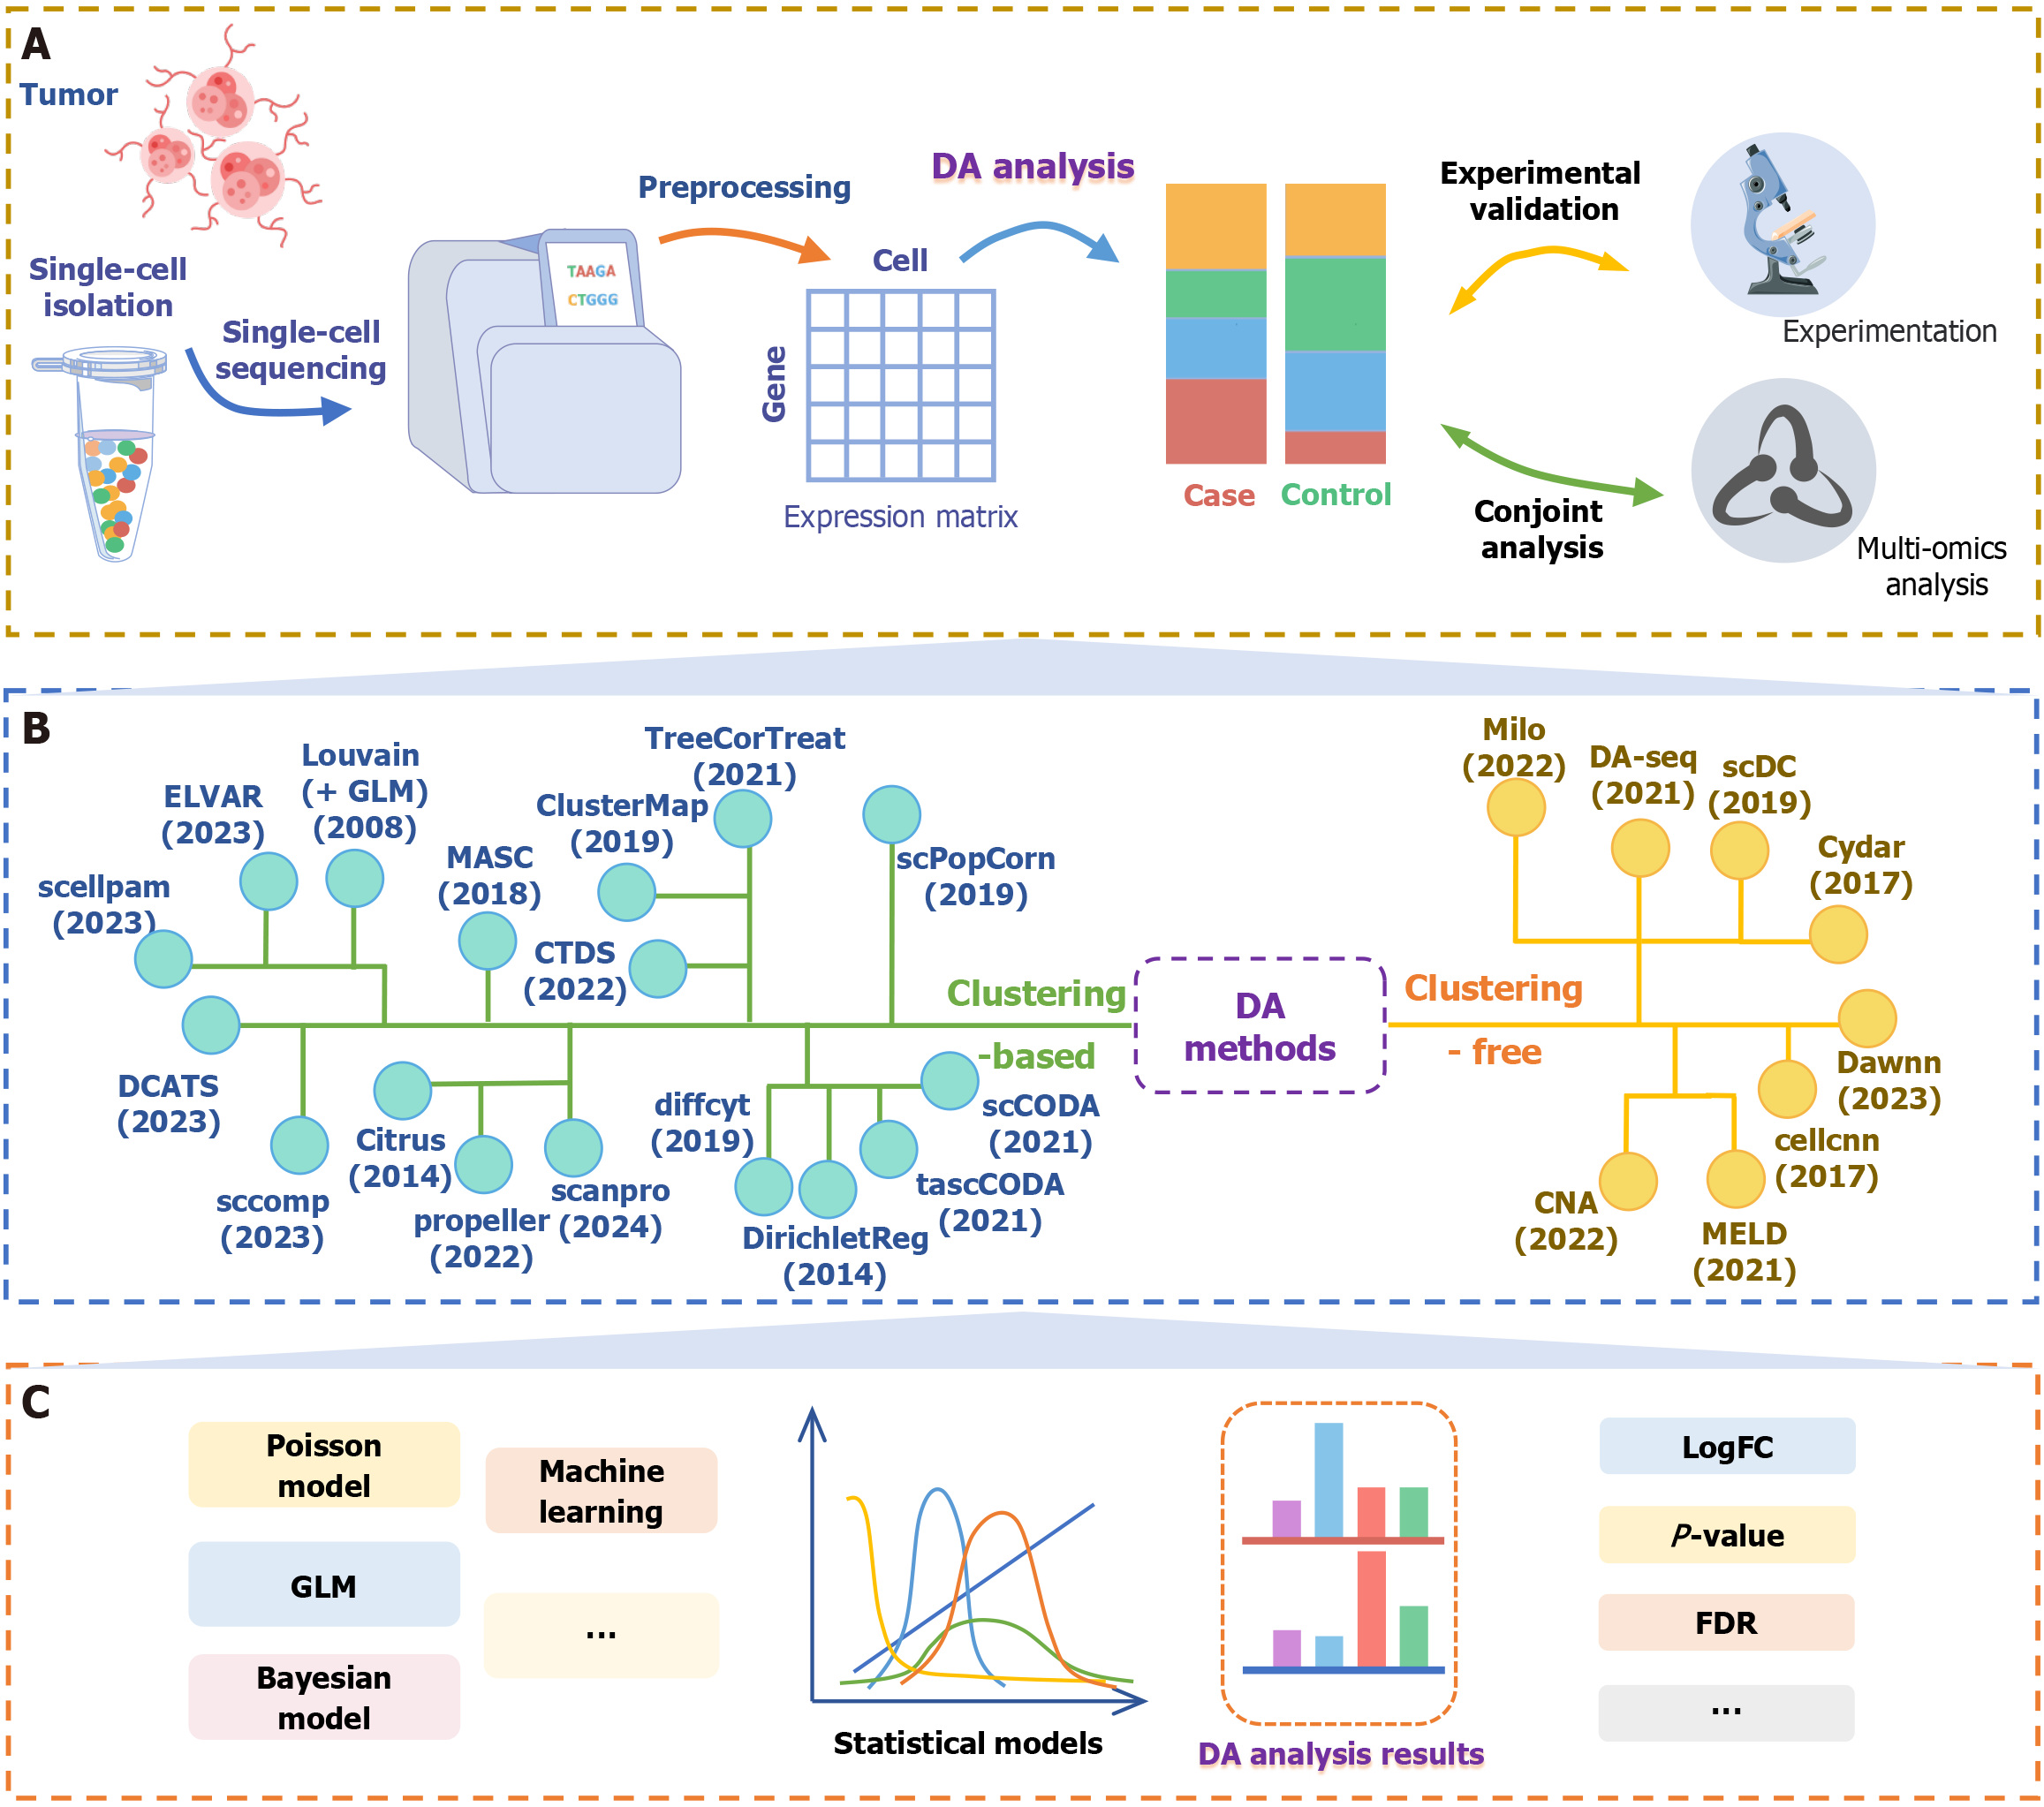
Figure 1 Overview of single-cell differential abundance detection.
A: The general workflow of single-cell differential abundance (DA) analysis. Data obtained from single-cell sequencing are preprocessed and then subjected to DA detection. The results of DA detection are often validated experimentally or integrated with multi-omics data to facilitate deeper insights into the dataset; B: Single-cell DA methods can be broadly categorized based on whether they rely on clustering strategies; C: Common statistical models and typical output metrics used in single-cell DA detection. DA: Differential abundance; GLM: Generalized linear models; logFC: Log2 fold change; FDR: False discovery rate.
- Citation: Xiao YX, Sun J, Xie LL, Zou Y, Li T, Hao YJ, Li B. Single-cell differential abundance detection: A new angle on dissecting tumor heterogeneity. World J Clin Oncol 2026; 17(1): 113244
- URL: https://www.wjgnet.com/2218-4333/full/v17/i1/113244.htm
- DOI: https://dx.doi.org/10.5306/wjco.v17.i1.113244