
















©The Author(s) 2026.
World J Clin Oncol. Jan 24, 2026; 17(1): 112801
Published online Jan 24, 2026. doi: 10.5306/wjco.v17.i1.112801
Published online Jan 24, 2026. doi: 10.5306/wjco.v17.i1.112801
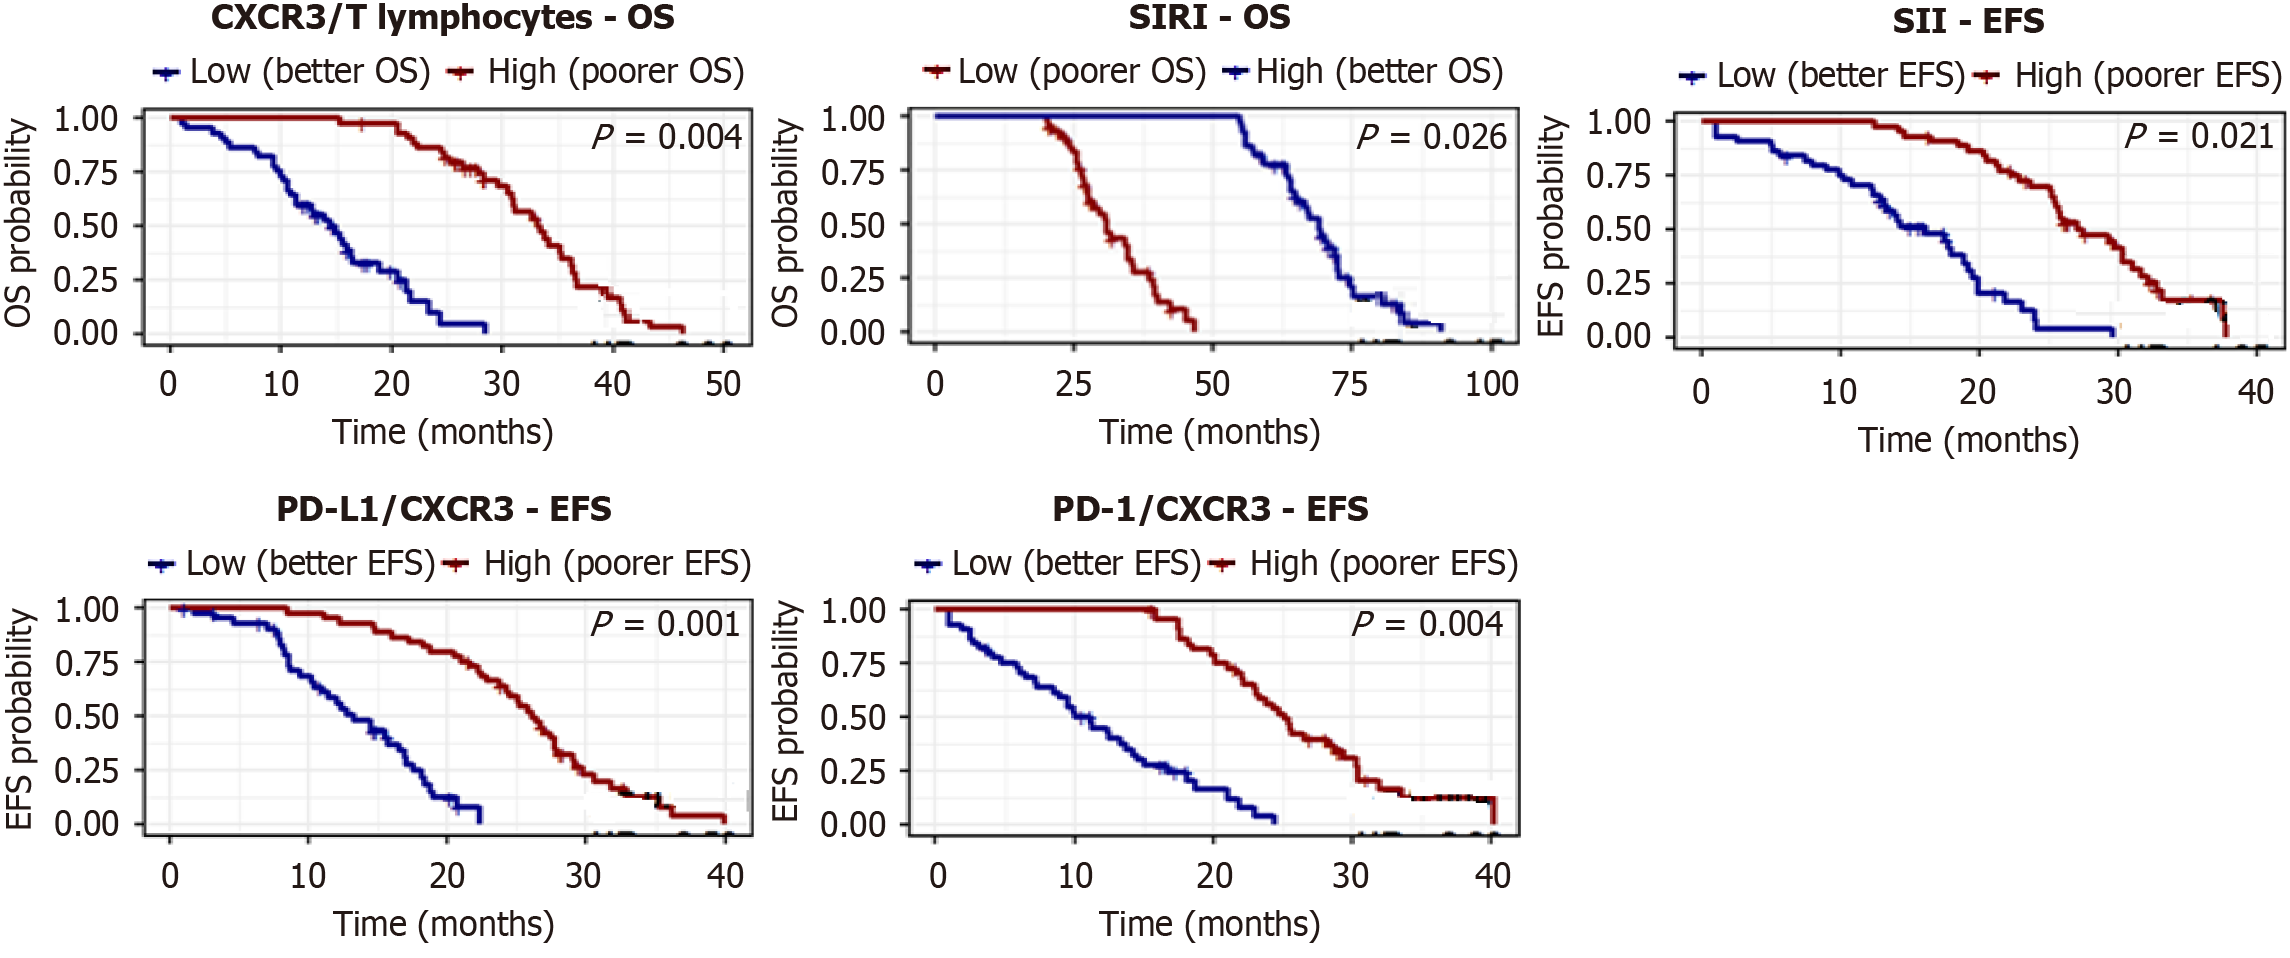
Figure 6 Kaplan-Meier survival curves for overall survival and event-free survival stratified by high vs low biomarker levels in patients with lymphoproliferative neoplasms (n = 90).
Panels show overall survival for C-X-C motif chemokine receptor 3 (CXCR3)/T lymphocytes and the systemic inflammation response index, and event-free survival for the systemic immune-inflammation index, programmed death-ligand 1/CXCR3, and programmed cell death protein 1/CXCR3. P-values are from log-rank tests, with risk tables below each curve. Biomarkers with the lowest P-values from multivariate Cox regression. CXCR3: C-X-C motif chemokine receptor 3; OS: Overall survival; SIRI: Systemic inflammation response index; SII: Systemic immune-inflammation index; EFS: Event-free survival; PD-L1: Programmed death-ligand 1; PD-1: Programmed cell death protein 1.
- Citation: Sherief DE, Nosair N, Abdelhameed AM, Sadaka E, Othman AAA, Elgamal R. Prognostic significance of PD-L1/PD-1 co-expression and CXCR3-driven inflammatory signatures in Egyptian patients with lymphoproliferative neoplasms. World J Clin Oncol 2026; 17(1): 112801
- URL: https://www.wjgnet.com/2218-4333/full/v17/i1/112801.htm
- DOI: https://dx.doi.org/10.5306/wjco.v17.i1.112801