
















©The Author(s) 2026.
World J Clin Oncol. Jan 24, 2026; 17(1): 112369
Published online Jan 24, 2026. doi: 10.5306/wjco.v17.i1.112369
Published online Jan 24, 2026. doi: 10.5306/wjco.v17.i1.112369
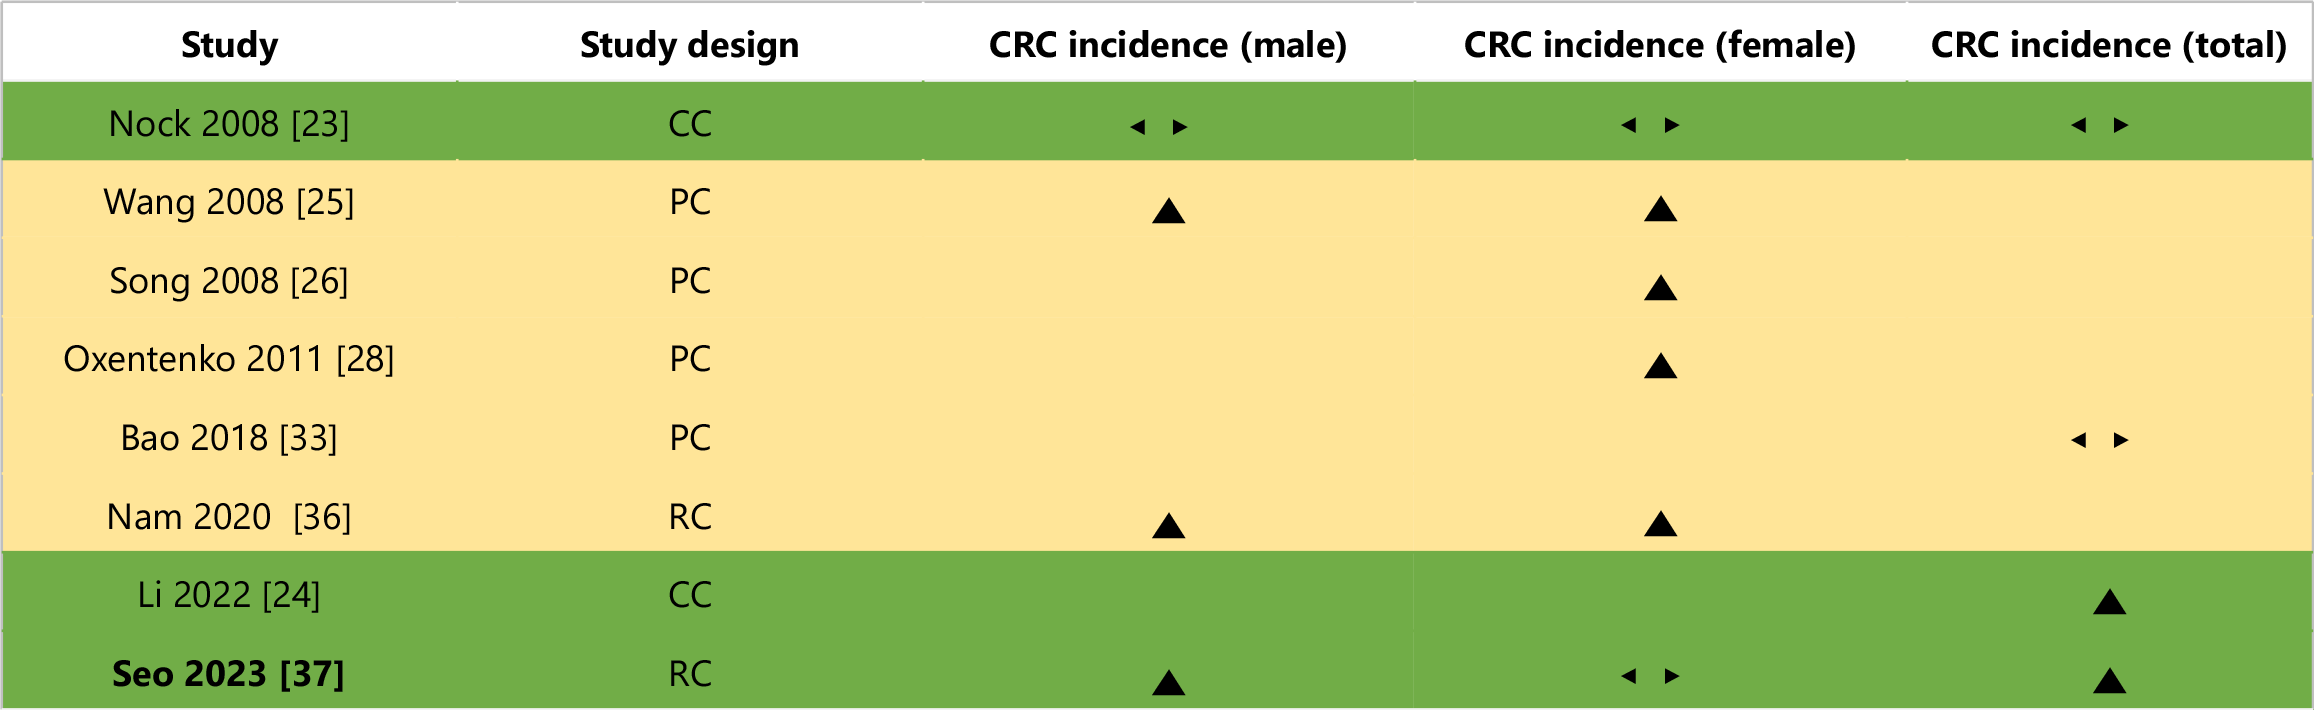
Figure 2 Effect direction plot for studies not included in meta-analyses.
Effect direction: ▲ = Positive health impact, ▼ = Negative health impact, ◄► = No change/mixed effects/conflicting findings. Sample size: Final sample size (individuals) in intervention group large arrow ▲ > 300; medium arrow ▲ 50-300; small arrow ▲ < 50. Study quality: Denoted by row colour: Green = Low risk of bias; amber = Some concerns; red = High risk of bias. CC: Case-control; PC: Prospective cohort; RC: Retrospective cohort.
- Citation: Leung LJCL, Sharma RS, Cheng B, Akalanka HK, Gopalan V. Obesity and colorectal cancer risk: A systematic review and meta-analysis. World J Clin Oncol 2026; 17(1): 112369
- URL: https://www.wjgnet.com/2218-4333/full/v17/i1/112369.htm
- DOI: https://dx.doi.org/10.5306/wjco.v17.i1.112369