Copyright
©The Author(s) 2025.
World J Clin Oncol. Jul 24, 2025; 16(7): 108967
Published online Jul 24, 2025. doi: 10.5306/wjco.v16.i7.108967
Published online Jul 24, 2025. doi: 10.5306/wjco.v16.i7.108967
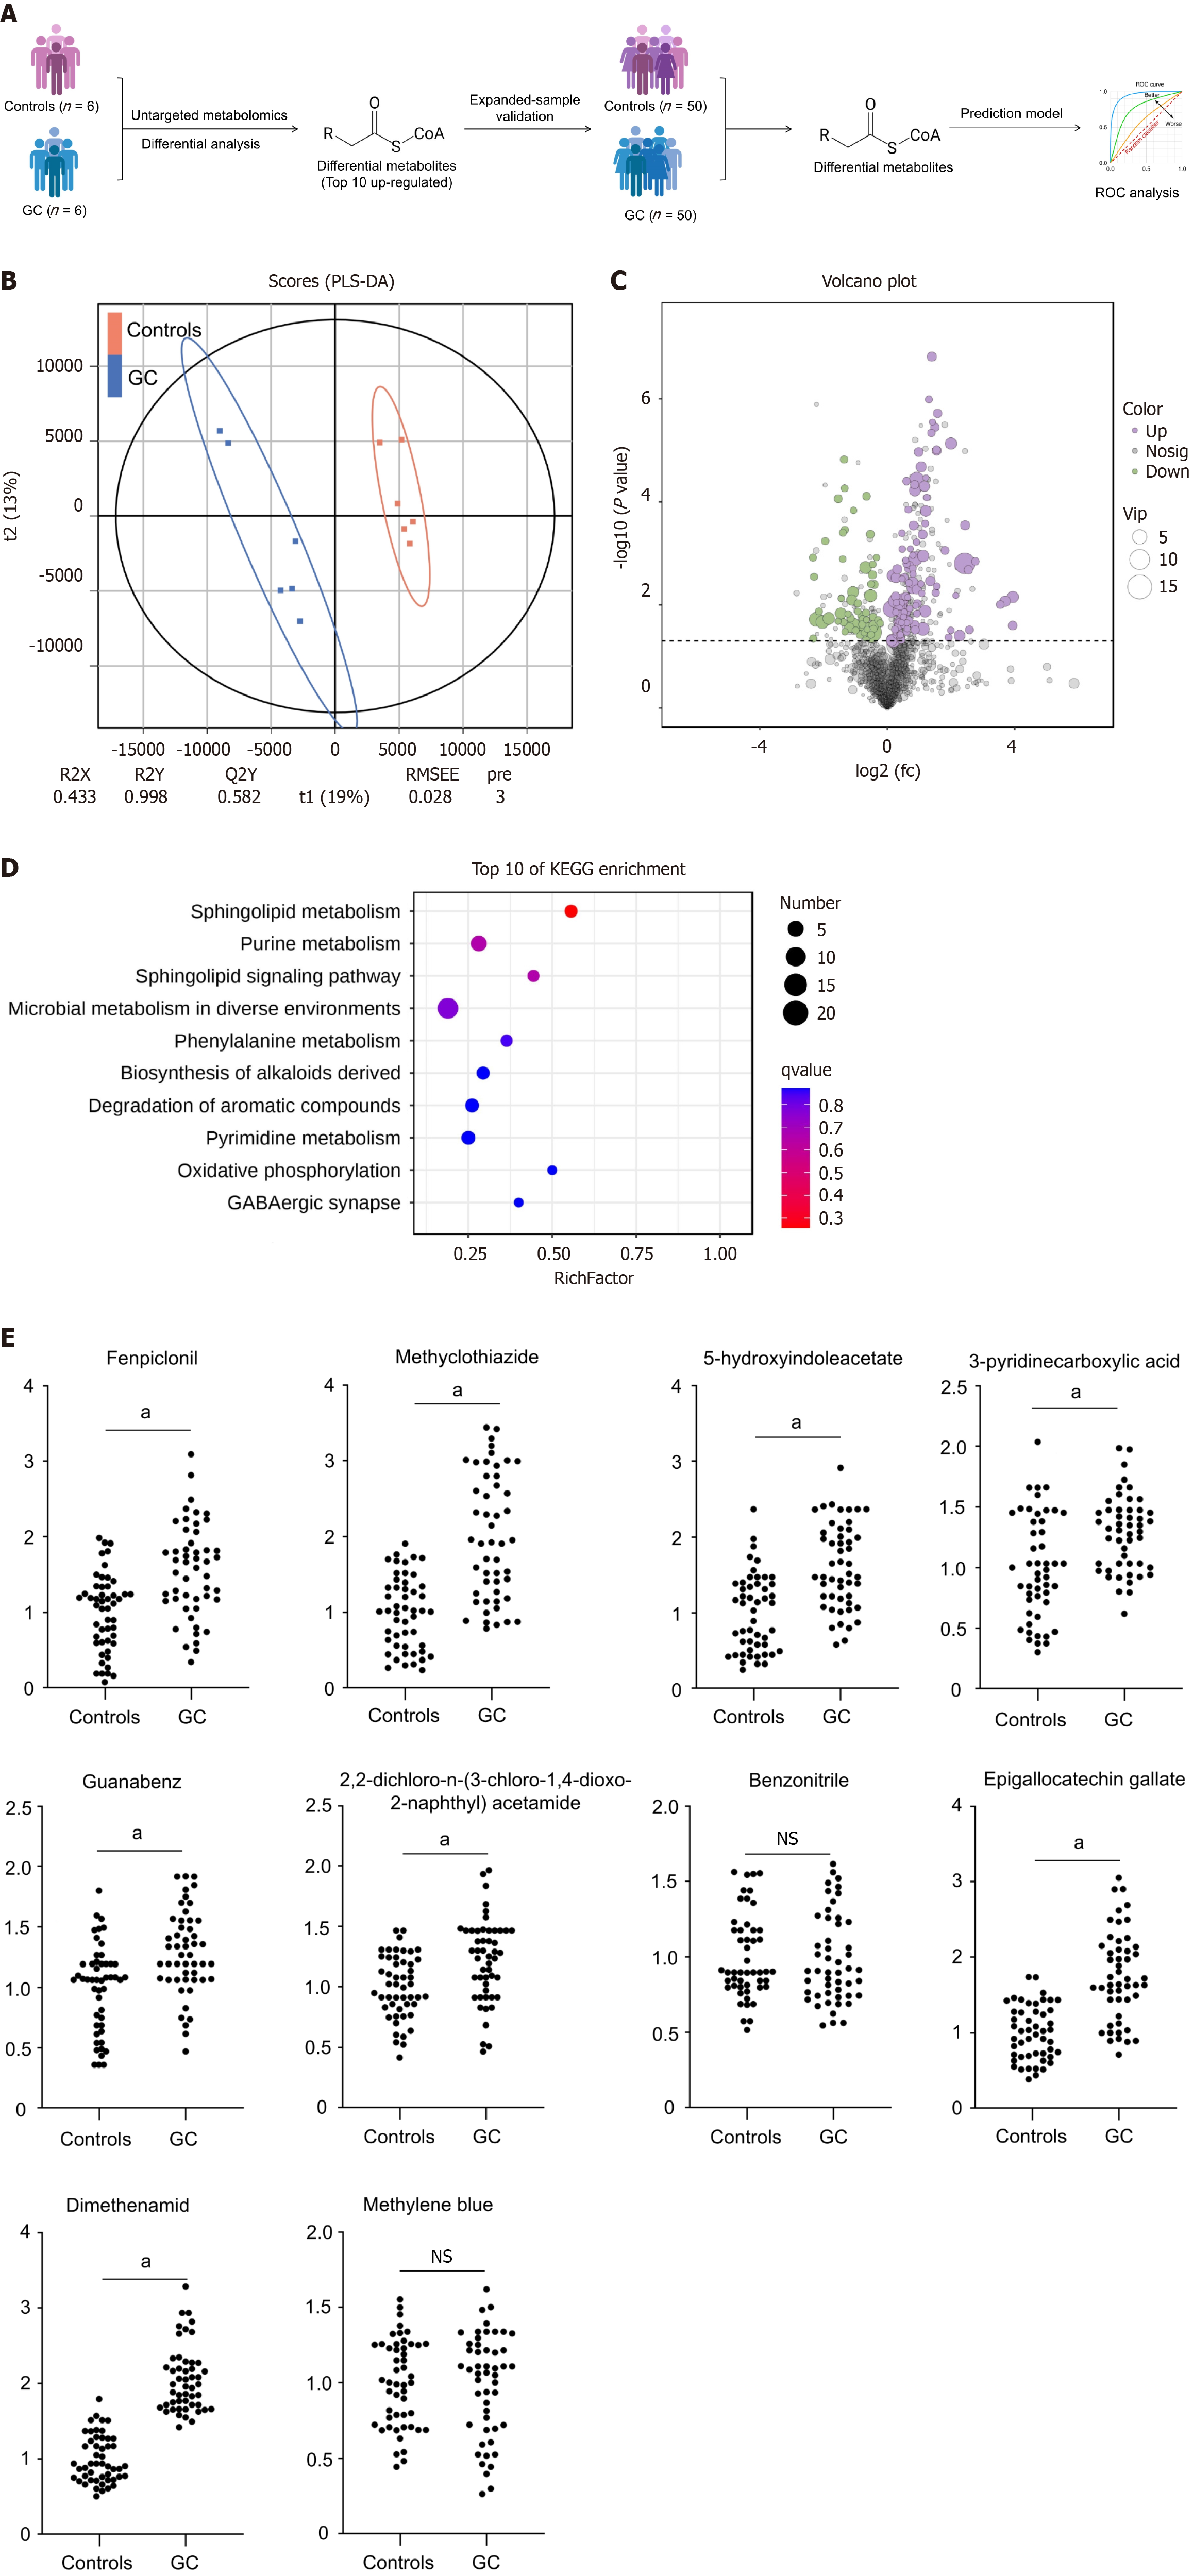
Figure 1 Analyses of serum metabolic profiling in patients with gastric carcinoma and healthy controls.
aP < 0.01. A: Schematic of the study design; B: Partial least squares discrimination analysis score plots show discrimination between the patients with gastric carcinoma (GC) and healthy controls; C: Volcano map of differentially metabolites between the patients with GC and healthy controls; D: Kyoto Encyclopedia of Genes and Genomes pathway enrichment analysis of significantly different metabolites; E: Comparative analysis of the relative levels of the top 10 up-regulated differential metabolites in the serum of 50 patients diagnosed with GC vs 50 healthy control subjects. NS: No significance; GC: Gastric carcinoma; ROC: Receiver operating characteristic; PLS-DA: Partial least squares discrimination analysis; KEGG: Kyoto Encyclopedia of Genes and Genomes.
- Citation: Ren L, Liu J, Xu YY, Shi ZW. Untargeted metabolomics analysis of serum metabolic signatures as novel biomarkers for gastric carcinoma. World J Clin Oncol 2025; 16(7): 108967
- URL: https://www.wjgnet.com/2218-4333/full/v16/i7/108967.htm
- DOI: https://dx.doi.org/10.5306/wjco.v16.i7.108967


