Copyright
©The Author(s) 2025.
World J Clin Oncol. Jul 24, 2025; 16(7): 108095
Published online Jul 24, 2025. doi: 10.5306/wjco.v16.i7.108095
Published online Jul 24, 2025. doi: 10.5306/wjco.v16.i7.108095
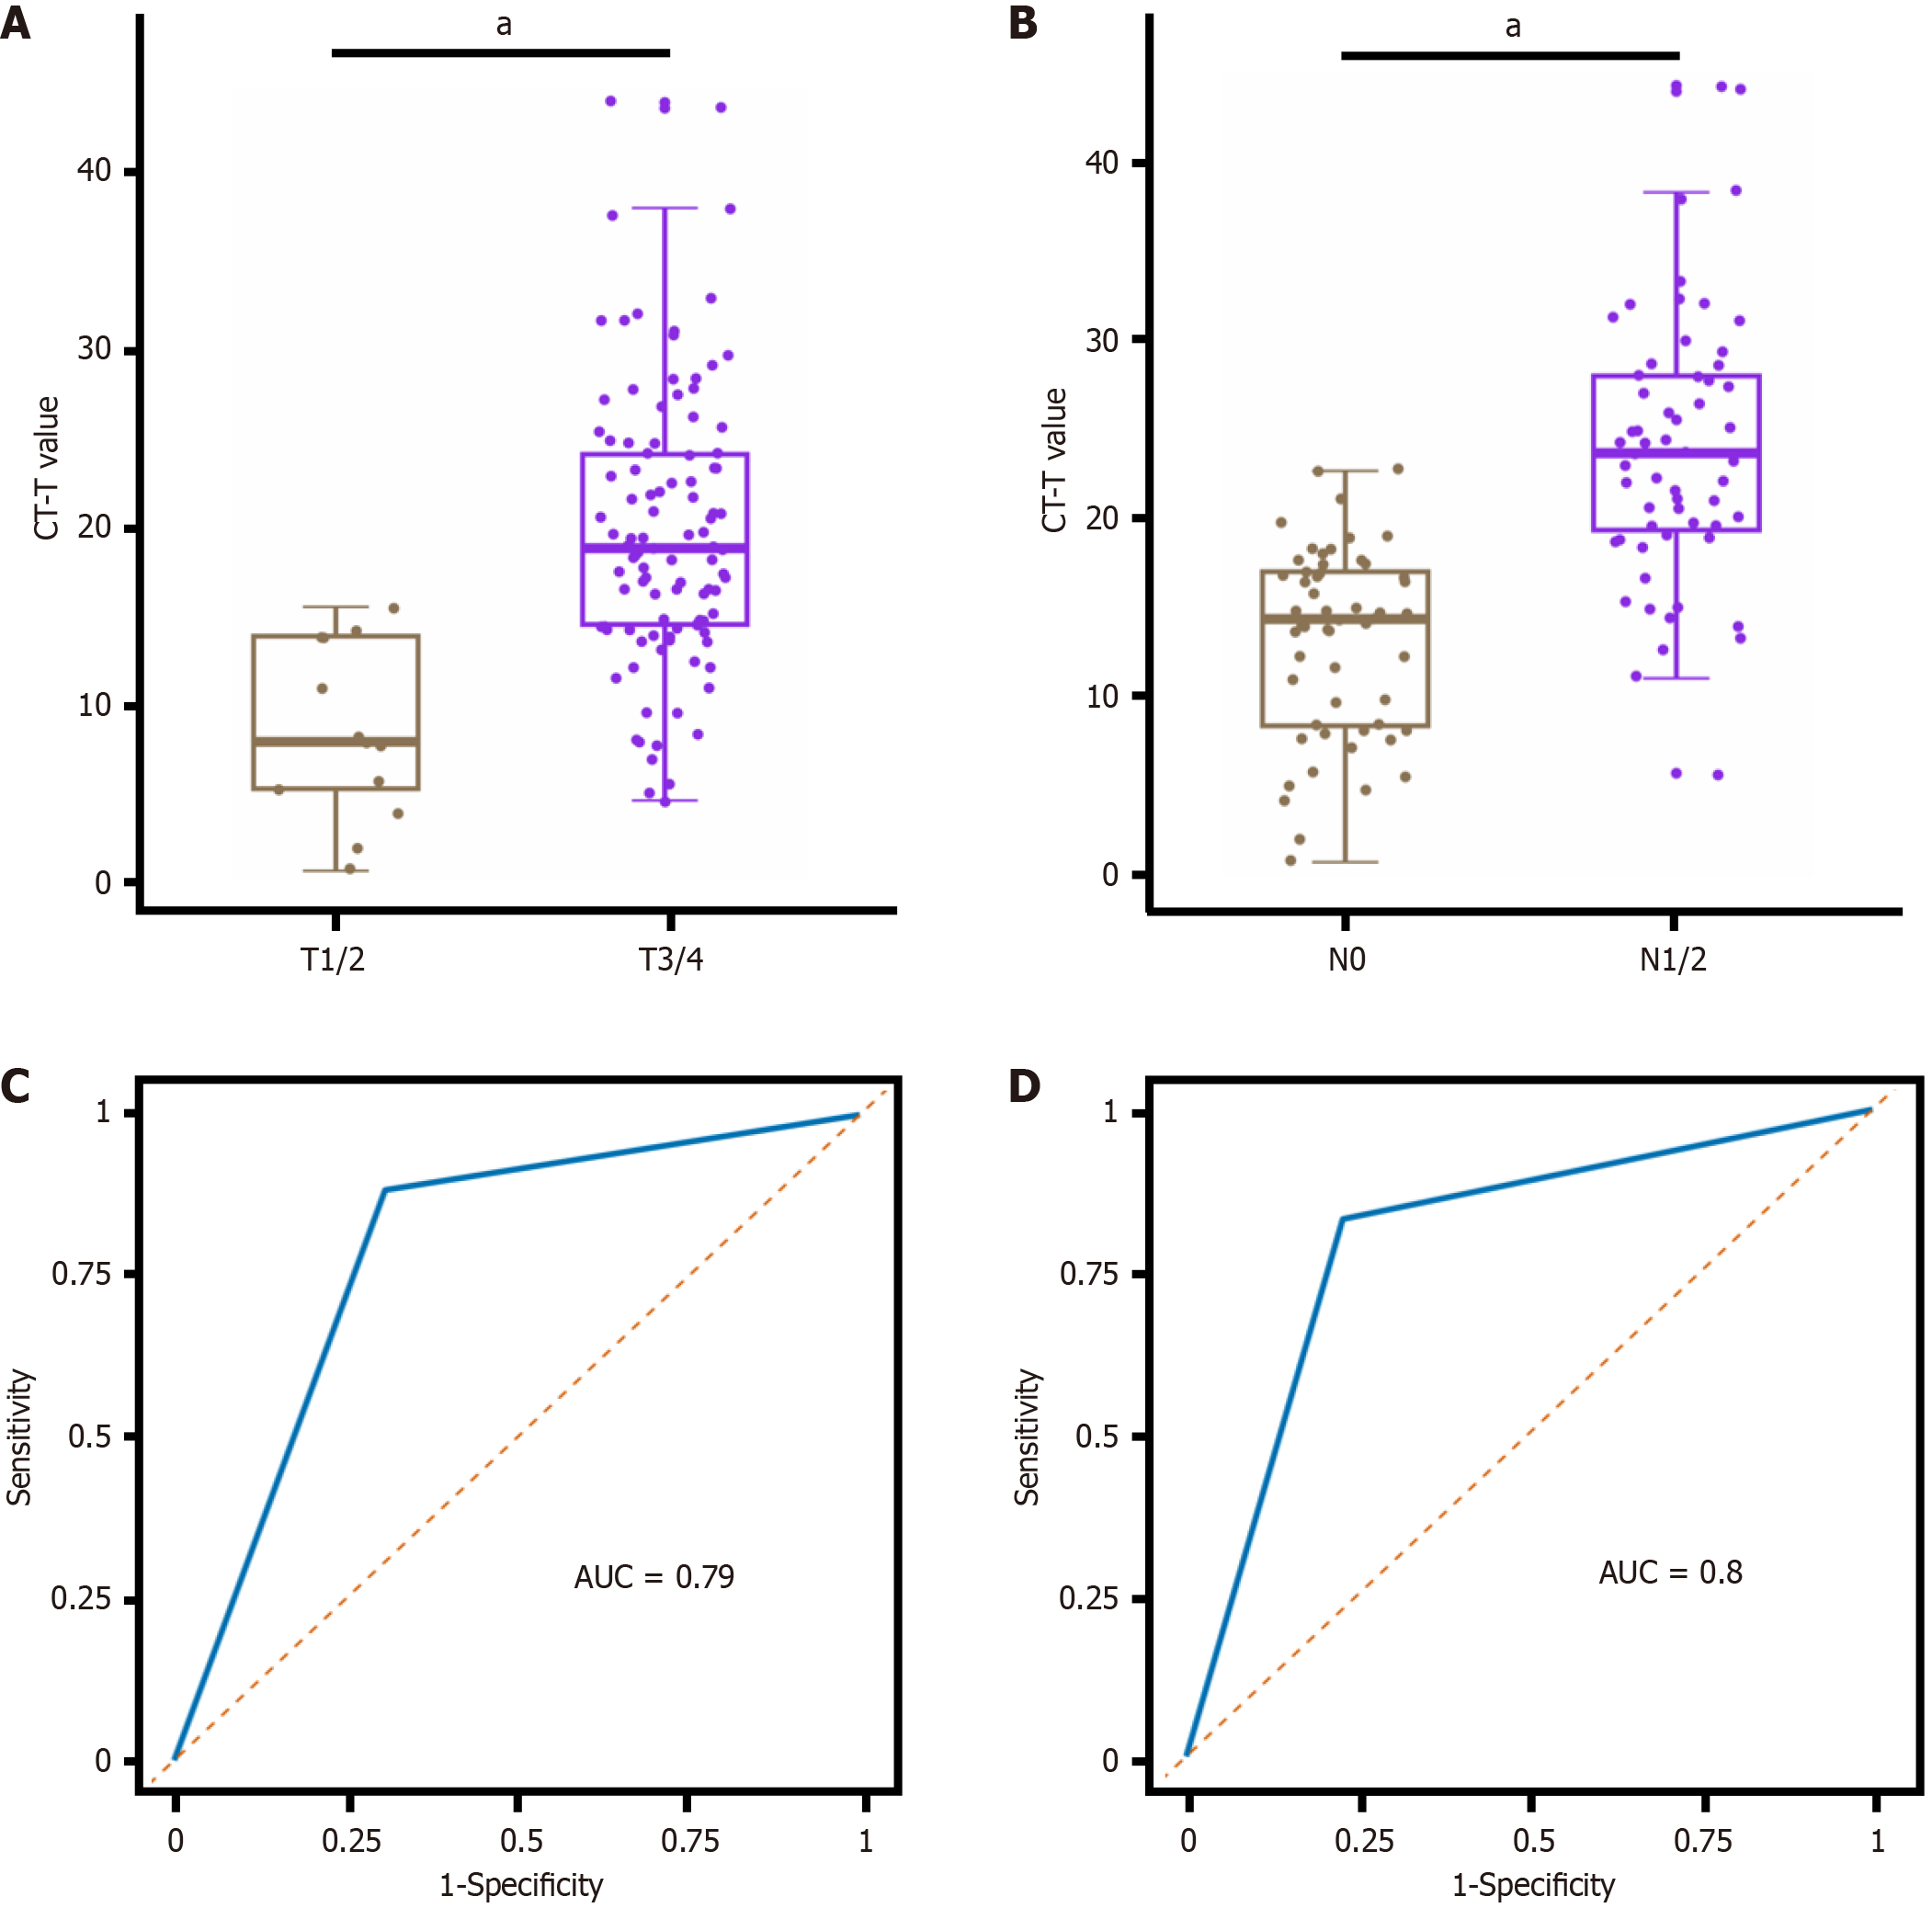
Figure 2 The Box-whisker plots and receiver operating characteristic plots for tumor-contributed computed tomography value to discriminate T and N stages in the validation cohort.
A: The Box-whisker plot for tumor-contributed computed tomography value (CT-T value) values in patients with T1/2 vs T3/4 stages; B: The Box-whisker plot for CT-T values in patients with N0 vs N1/2 stages; C: The receiver operating characteristic (ROC) plot for CT-T value to discriminate T1/2 vs T3/4 stages; D: The ROC plot for CT-T value to discriminate N0 vs N1/2 stages (aP < 0.01). AUC: Area under the receiver operating characteristic curve; CT-T: Tumor-contributed computed tomography.
- Citation: Wang F, Huang C, Ma HQ, Yao XQ, Wang JJ, Long J. Mesentery morphological features on computed tomography for preoperative prediction of tumor invasion and lymph node metastasis in colon cancer. World J Clin Oncol 2025; 16(7): 108095
- URL: https://www.wjgnet.com/2218-4333/full/v16/i7/108095.htm
- DOI: https://dx.doi.org/10.5306/wjco.v16.i7.108095


