Copyright
©The Author(s) 2025.
World J Clin Oncol. May 24, 2025; 16(5): 104138
Published online May 24, 2025. doi: 10.5306/wjco.v16.i5.104138
Published online May 24, 2025. doi: 10.5306/wjco.v16.i5.104138
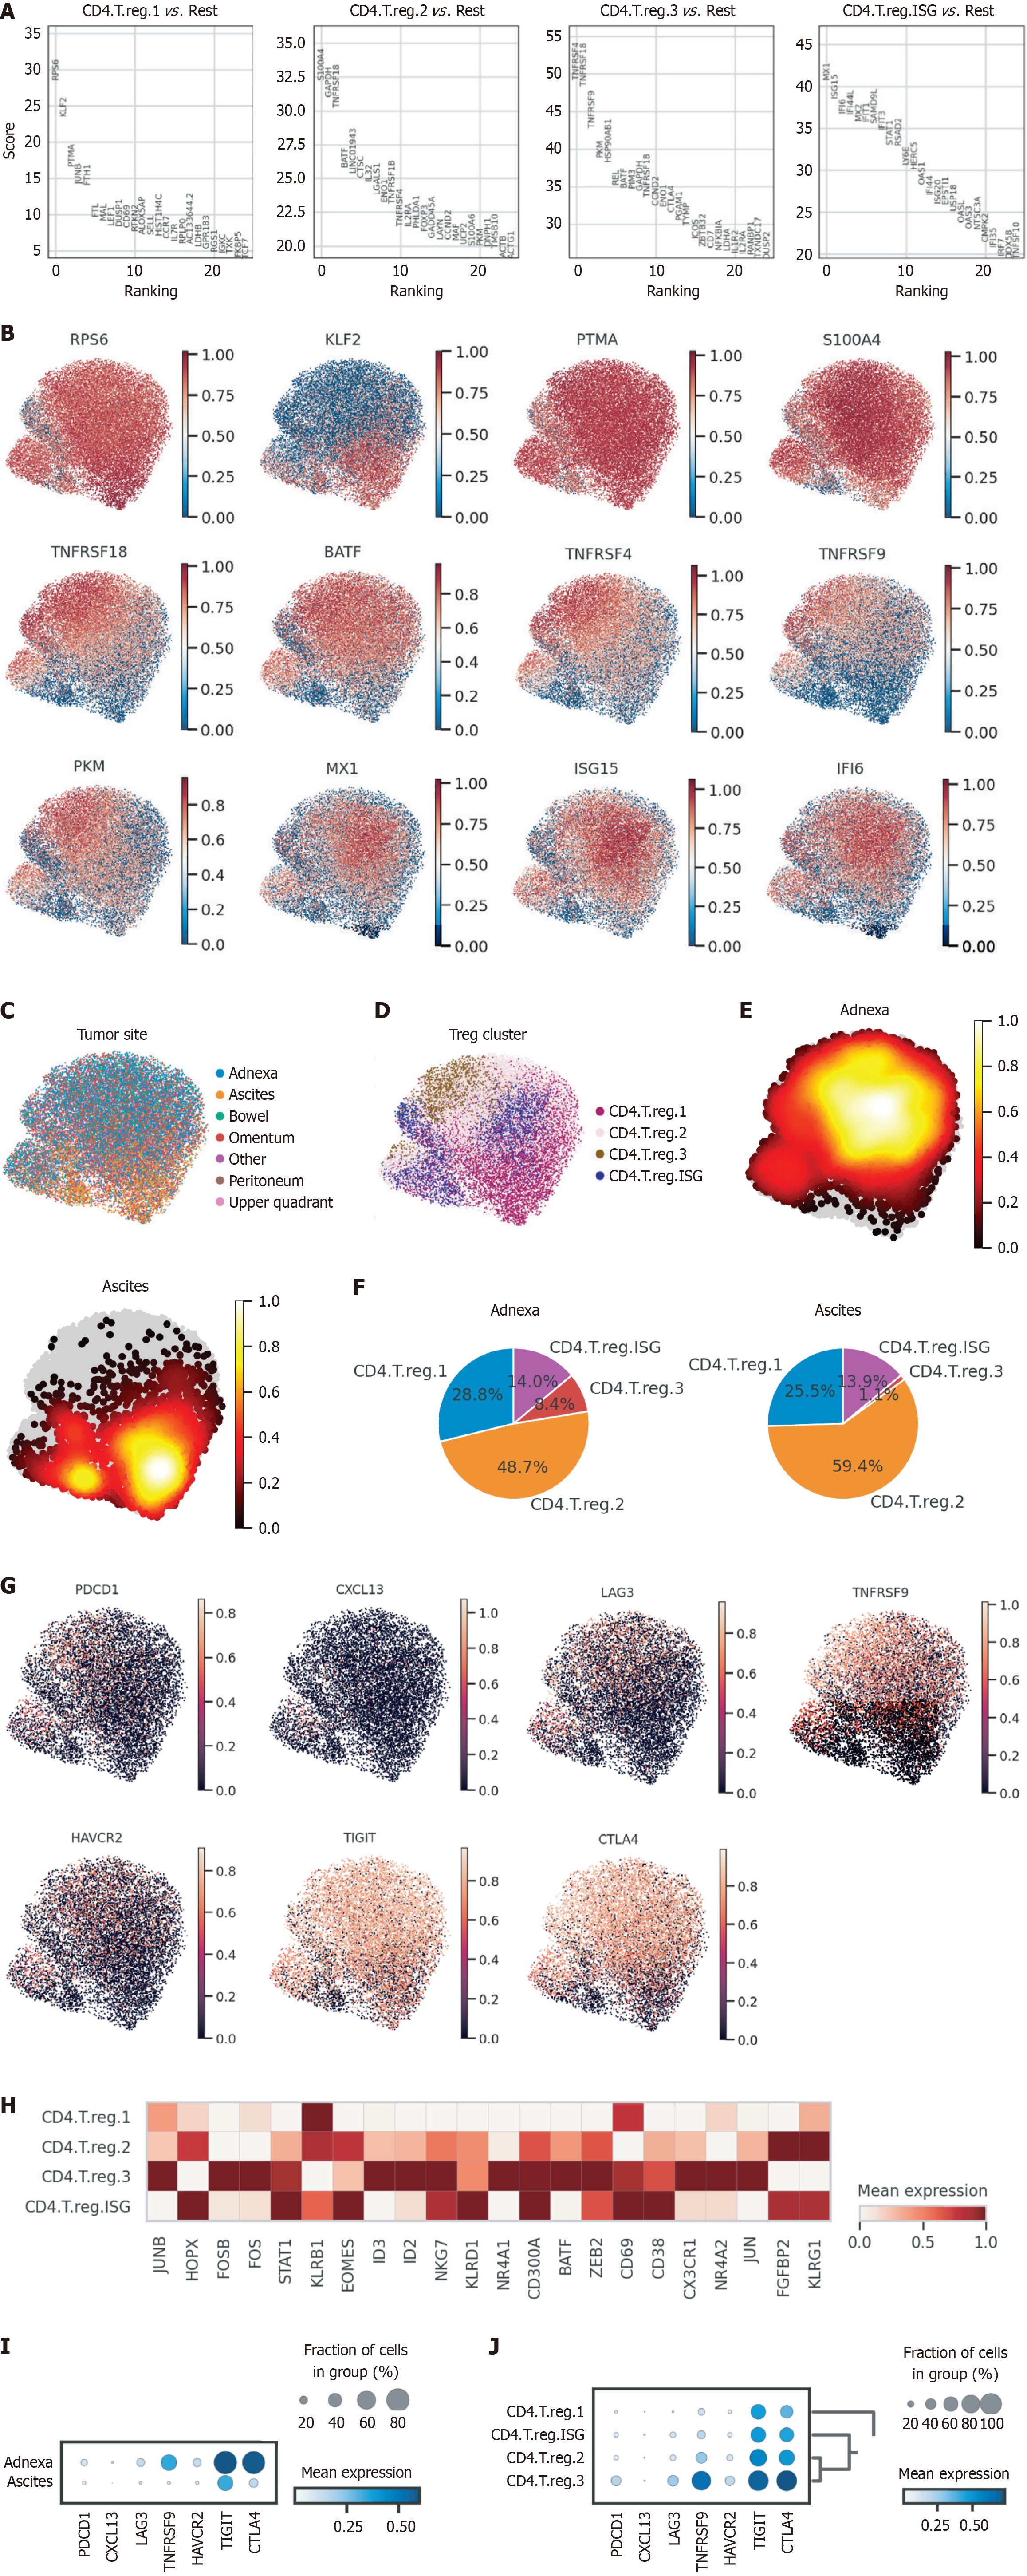
Figure 3 Differential distribution and functional profiling of regulatory T cell subtypes in adnexa and ascites.
A: Marker gene ranking for CD4+ Treg subtypes; B: UMAP plots illustrating the expression of key marker genes across CD4+ Treg subtypes; C: Correlation heatmap of CD4+ T cell subtypes between adnexal tissues and ascites; D: UMAP visualization of CD4+ Treg subtypes; E: Density distribution of Treg cells in adnexa and ascites; F: Proportional distribution of CD4+ Treg subtypes in adnexa and ascites; G: UMAP visualization of exhaustion and activation marker expression in Treg cells; H: Heatmap of key transcriptional regulators and marker expression across Treg subtypes; I: Expression levels and group distribution of exhaustion markers in Treg cells across adnexa and ascites; J: Exhaustion marker expression across Treg subtypes.
- Citation: Zhang BL, Gao W, He L, Liu XT, Wang ZM, Tan L. Functional heterogeneity and clinical implications of CD4+ T cell subtypes in high-grade serous ovarian carcinoma. World J Clin Oncol 2025; 16(5): 104138
- URL: https://www.wjgnet.com/2218-4333/full/v16/i5/104138.htm
- DOI: https://dx.doi.org/10.5306/wjco.v16.i5.104138


