
















©The Author(s) 2025.
World J Clin Oncol. Oct 24, 2025; 16(10): 110511
Published online Oct 24, 2025. doi: 10.5306/wjco.v16.i10.110511
Published online Oct 24, 2025. doi: 10.5306/wjco.v16.i10.110511
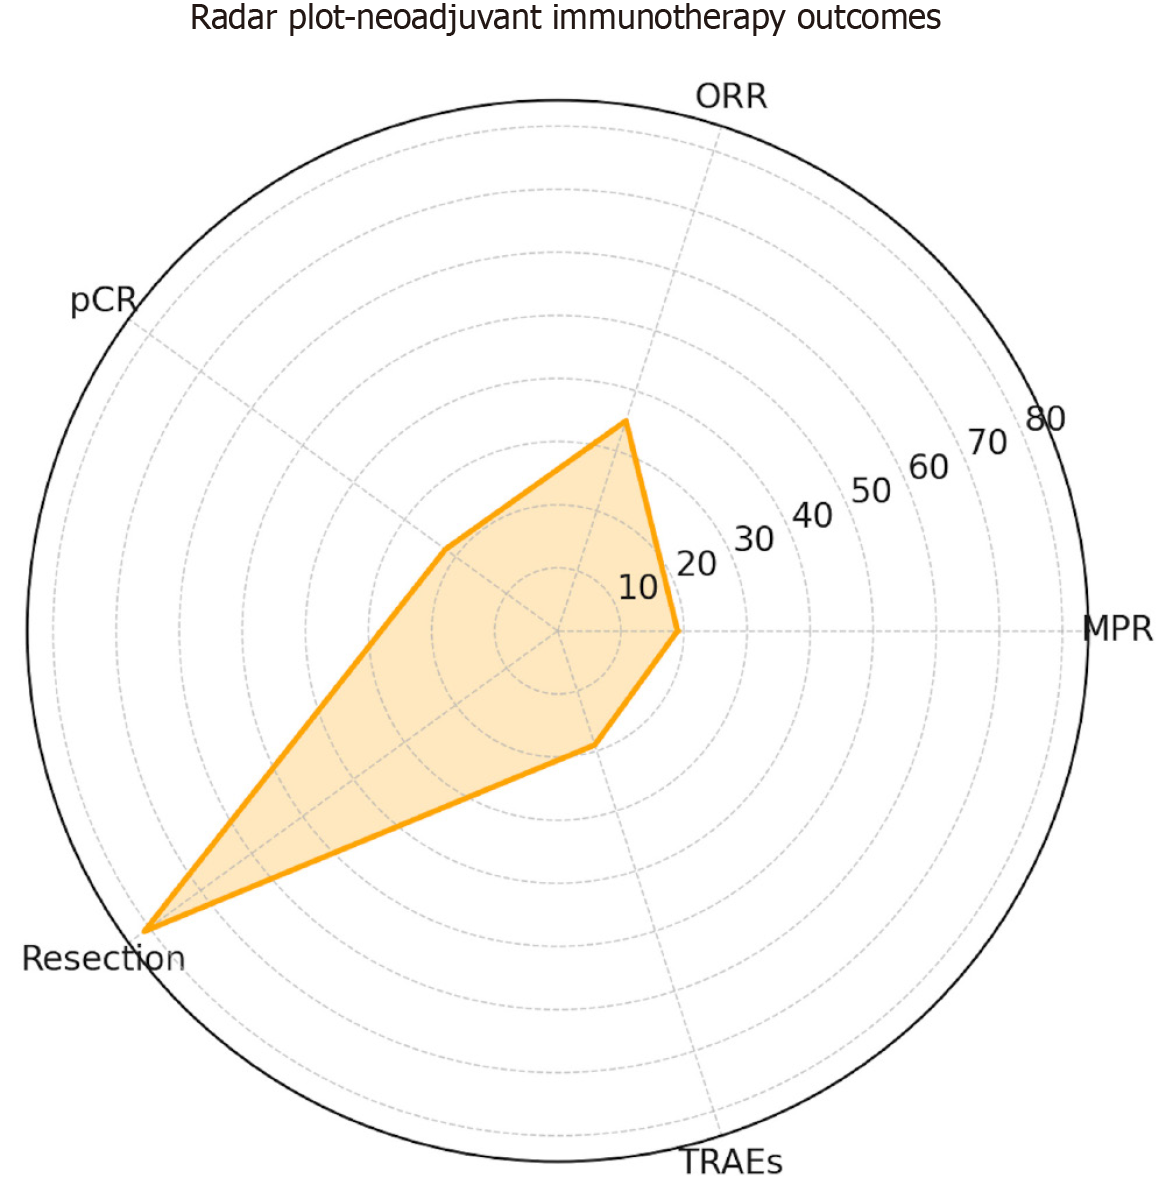
Figure 3 Radar plot of pooled event rates across clinical endpoints.
Radar plot displaying pooled event rates for key clinical endpoints: 19% for major pathological response, 35% for overall response rate, 22% for pathological complete response, 81% for resection rate, and 19% for grade 3-4 treatment-related adverse events. pCR: Pathological complete response; MPR: Major pathological response; ORR: Overall response rate; TRAE: Treatment-related adverse event.
- Citation: Cicerone O, Oliviero B, Mantovani S, Maiocchi L, Ravetta V, Berton F, Corallo S, Vanoli A, Maestri M. Neoadjuvant immunotherapy in resectable hepatocellular carcinoma: A meta-analysis of the current evidence. World J Clin Oncol 2025; 16(10): 110511
- URL: https://www.wjgnet.com/2218-4333/full/v16/i10/110511.htm
- DOI: https://dx.doi.org/10.5306/wjco.v16.i10.110511