Copyright
©The Author(s) 2024.
World J Clin Oncol. Mar 24, 2024; 15(3): 434-446
Published online Mar 24, 2024. doi: 10.5306/wjco.v15.i3.434
Published online Mar 24, 2024. doi: 10.5306/wjco.v15.i3.434
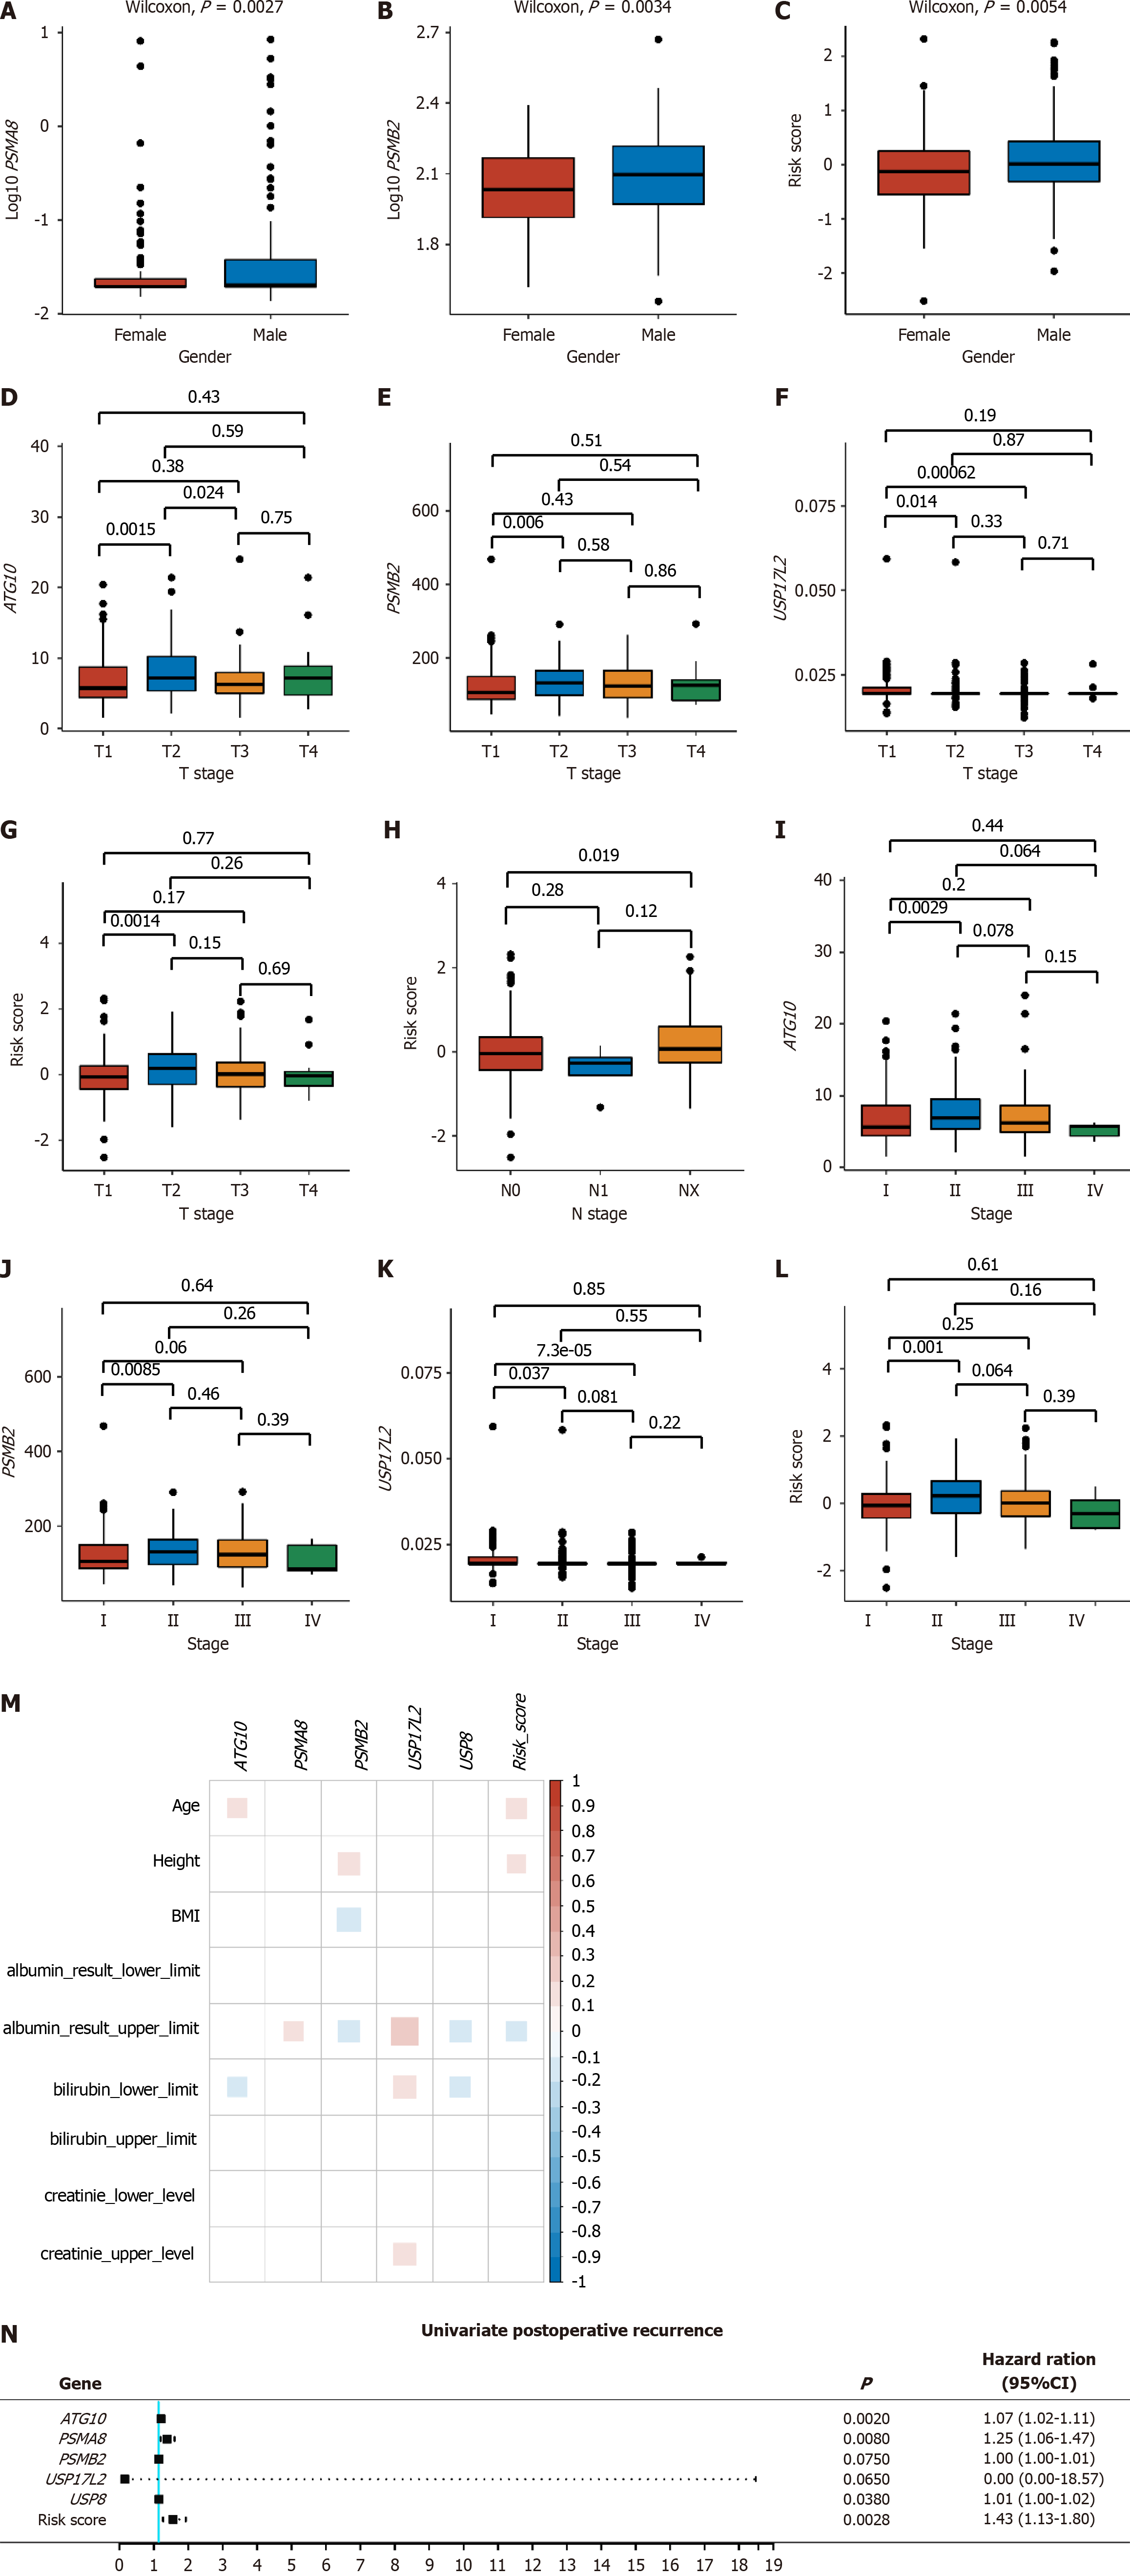
Figure 3 Correlation of expression levels of ATG10, PSMA8, PSMB2, USP17L2, and USP8 and risk score with clinical parameters.
A-C: Gene expression and risk score between genders; D-G: Gene expression and risk score among T stages; H: Risk score among N stages; I-L: Gene expression and risk score among clinical stages; M: Correlation of gene expression levels and risk score with biochemical indexes; N: Correlation of gene expression levels and risk score with postoperative recurrence in liver cancer, with a hazard ratio (HR) > 1 referring to a positive correlation and HR < 1 referring to a negative correlation. P < 0.05 indicated statistical significance. HR: Hazard ratio.
- Citation: Li H, Ma YP, Wang HL, Tian CJ, Guo YX, Zhang HB, Liu XM, Liu PF. Establishment of a prognosis predictive model for liver cancer based on expression of genes involved in the ubiquitin-proteasome pathway. World J Clin Oncol 2024; 15(3): 434-446
- URL: https://www.wjgnet.com/2218-4333/full/v15/i3/434.htm
- DOI: https://dx.doi.org/10.5306/wjco.v15.i3.434


