Copyright
©The Author(s) 2024.
World J Clin Oncol. Feb 24, 2024; 15(2): 329-355
Published online Feb 24, 2024. doi: 10.5306/wjco.v15.i2.329
Published online Feb 24, 2024. doi: 10.5306/wjco.v15.i2.329
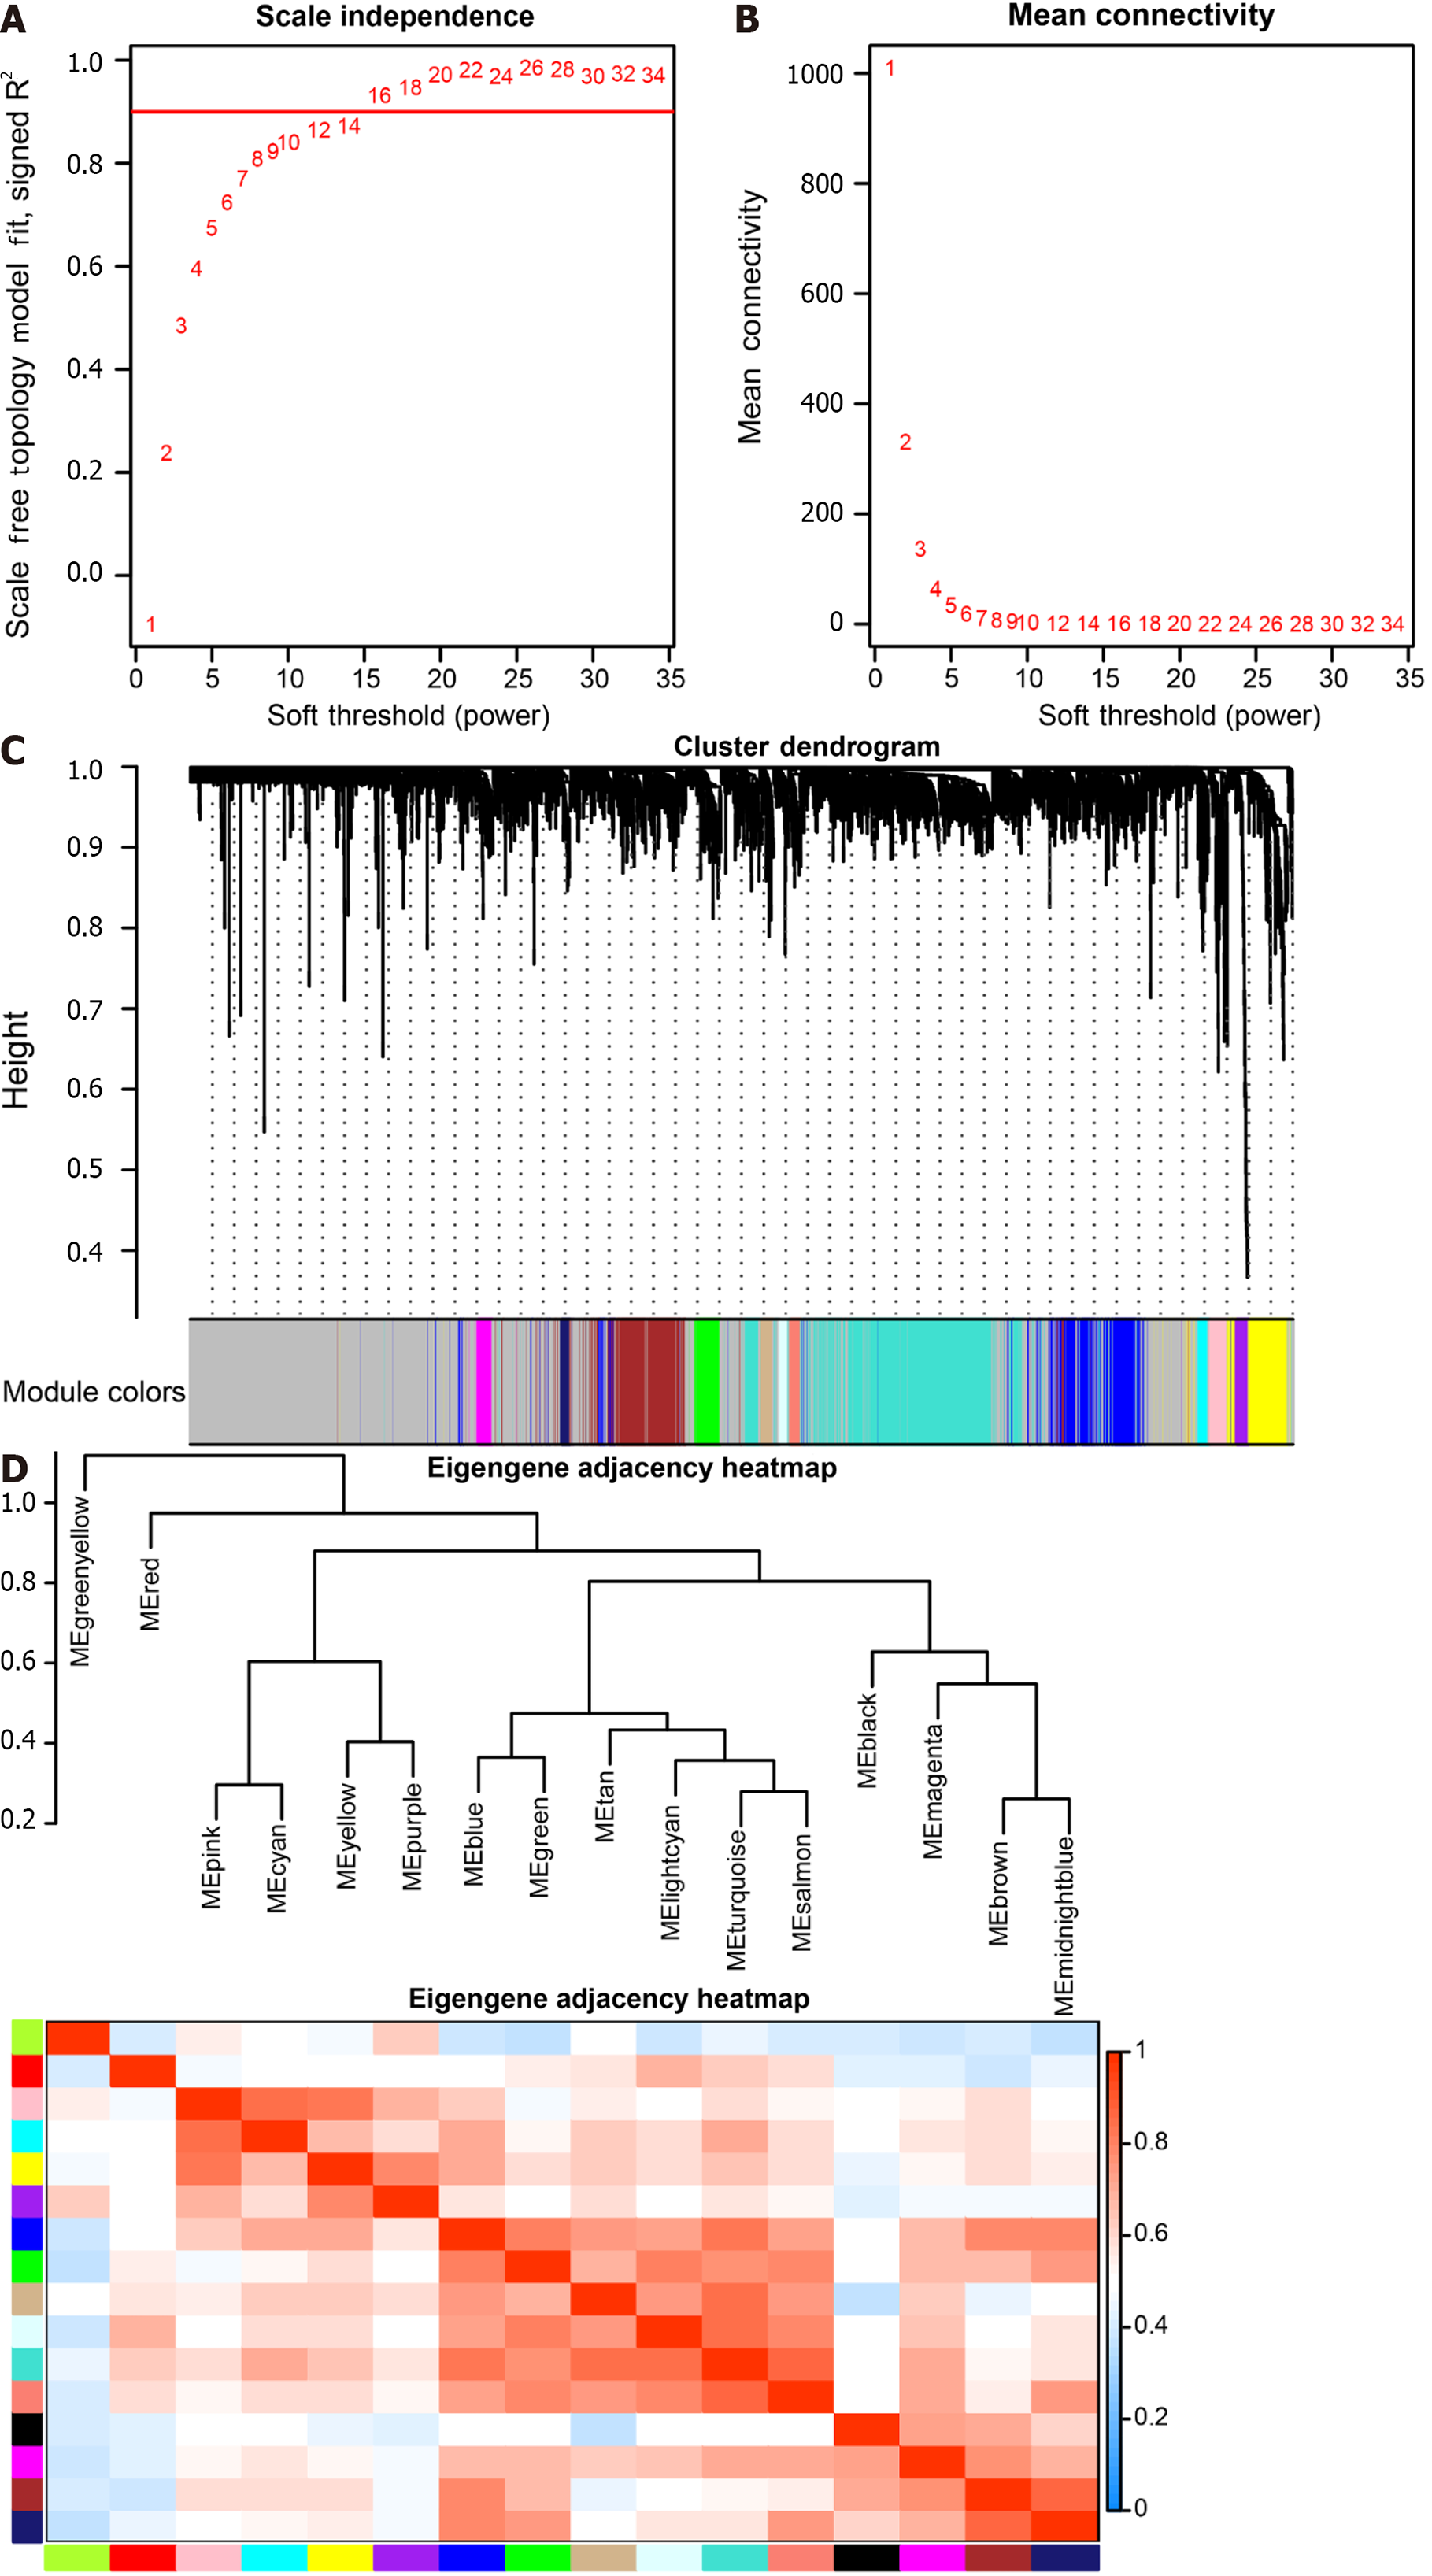
Figure 5 Weighted co-expression network analysis co-expression identifies cell type-dependent modules.
A: Analysis of the Scale-free Fit Index for soft threshold power (β) in the range of 1-34; B: Assessment of the Average Connectivity across soft-threshold powers (β) ranging from 1 to 34; C: Hierarchical clustering tree depicting genes based on their topological overlap; D: Correlation plot illustrating relationships between modules.
- Citation: Zhu LH, Yang J, Zhang YF, Yan L, Lin WR, Liu WQ. Identification and validation of a pyroptosis-related prognostic model for colorectal cancer based on bulk and single-cell RNA sequencing data. World J Clin Oncol 2024; 15(2): 329-355
- URL: https://www.wjgnet.com/2218-4333/full/v15/i2/329.htm
- DOI: https://dx.doi.org/10.5306/wjco.v15.i2.329


