Copyright
©The Author(s) 2024.
World J Clin Oncol. Feb 24, 2024; 15(2): 329-355
Published online Feb 24, 2024. doi: 10.5306/wjco.v15.i2.329
Published online Feb 24, 2024. doi: 10.5306/wjco.v15.i2.329
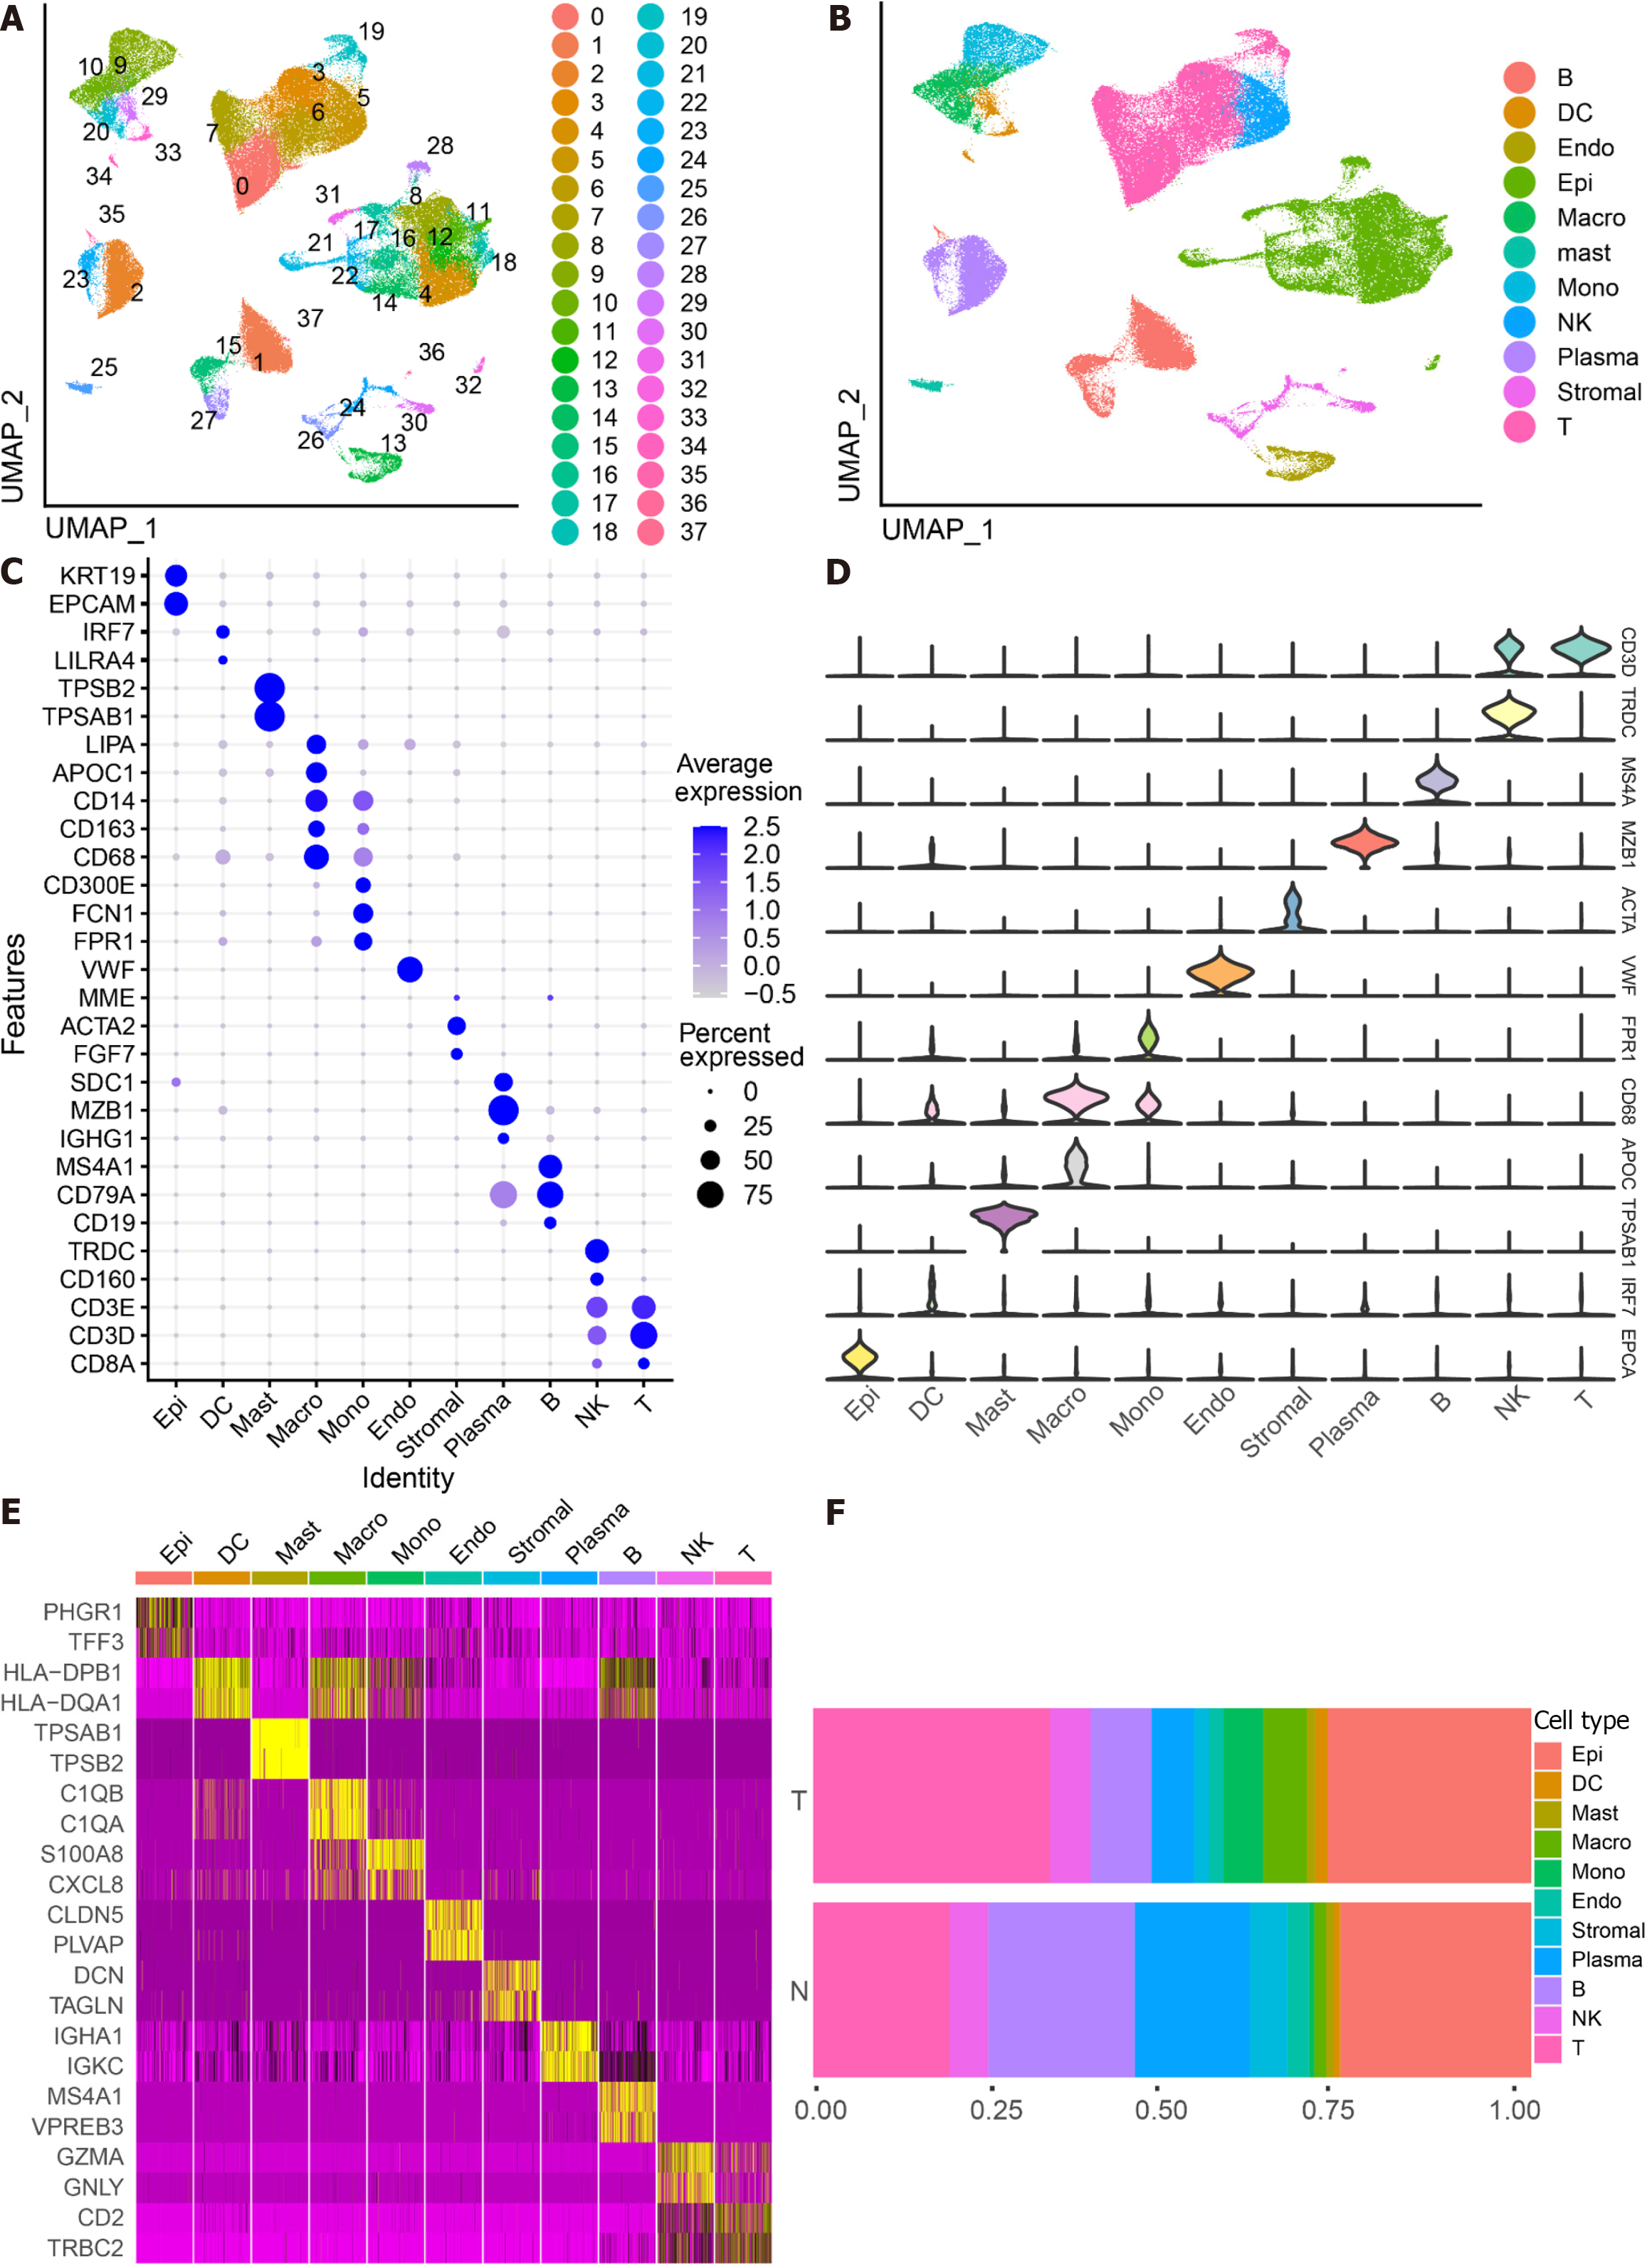
Figure 1 Identifies 11 cell clusters with different annotations based on single-cell RNA sequencing-seq data, revealing a high degree of cellular heterogeneity in colorectal cancer cells.
A: Selection of 88 samples from the GSE178341 dataset, followed by quality control, resulted in the inclusion of 115489 cells in the analysis, which were classified into 38 independent clusters. Different colors denote distinct clusters; B: Uniform Manifold Approximation and Projection distribution highlighting different cell types; C: Dot plot depicting cell type marker genes. Circle size corresponds to the proportion of gene expression in the cell cluster, with darker colors indicating higher average expression; D: Violin plot illustrating differential genes for each cell type; E: Heatmap showcasing the top 2 differential genes for each cell type; F: Proportion of each cell population in different samples, including epithelial cells (Epi, 27.79%), myeloid cells (DC, 1.55%; Macrophage, Macro, 4.86%; Monocyte, Mono, 4.16%), mast cells (Mast, 1.11%), endothelial cells (Endo, 2.28%), Stromal cells (Stroma, 3.03%), plasma (Plasma, 8.75%), B cells (B, 11.85%), NK cells (NK, 5.58%), and T cells (T, 29.02%).
- Citation: Zhu LH, Yang J, Zhang YF, Yan L, Lin WR, Liu WQ. Identification and validation of a pyroptosis-related prognostic model for colorectal cancer based on bulk and single-cell RNA sequencing data. World J Clin Oncol 2024; 15(2): 329-355
- URL: https://www.wjgnet.com/2218-4333/full/v15/i2/329.htm
- DOI: https://dx.doi.org/10.5306/wjco.v15.i2.329


