Copyright
©The Author(s) 2024.
World J Clin Oncol. Feb 24, 2024; 15(2): 243-270
Published online Feb 24, 2024. doi: 10.5306/wjco.v15.i2.243
Published online Feb 24, 2024. doi: 10.5306/wjco.v15.i2.243
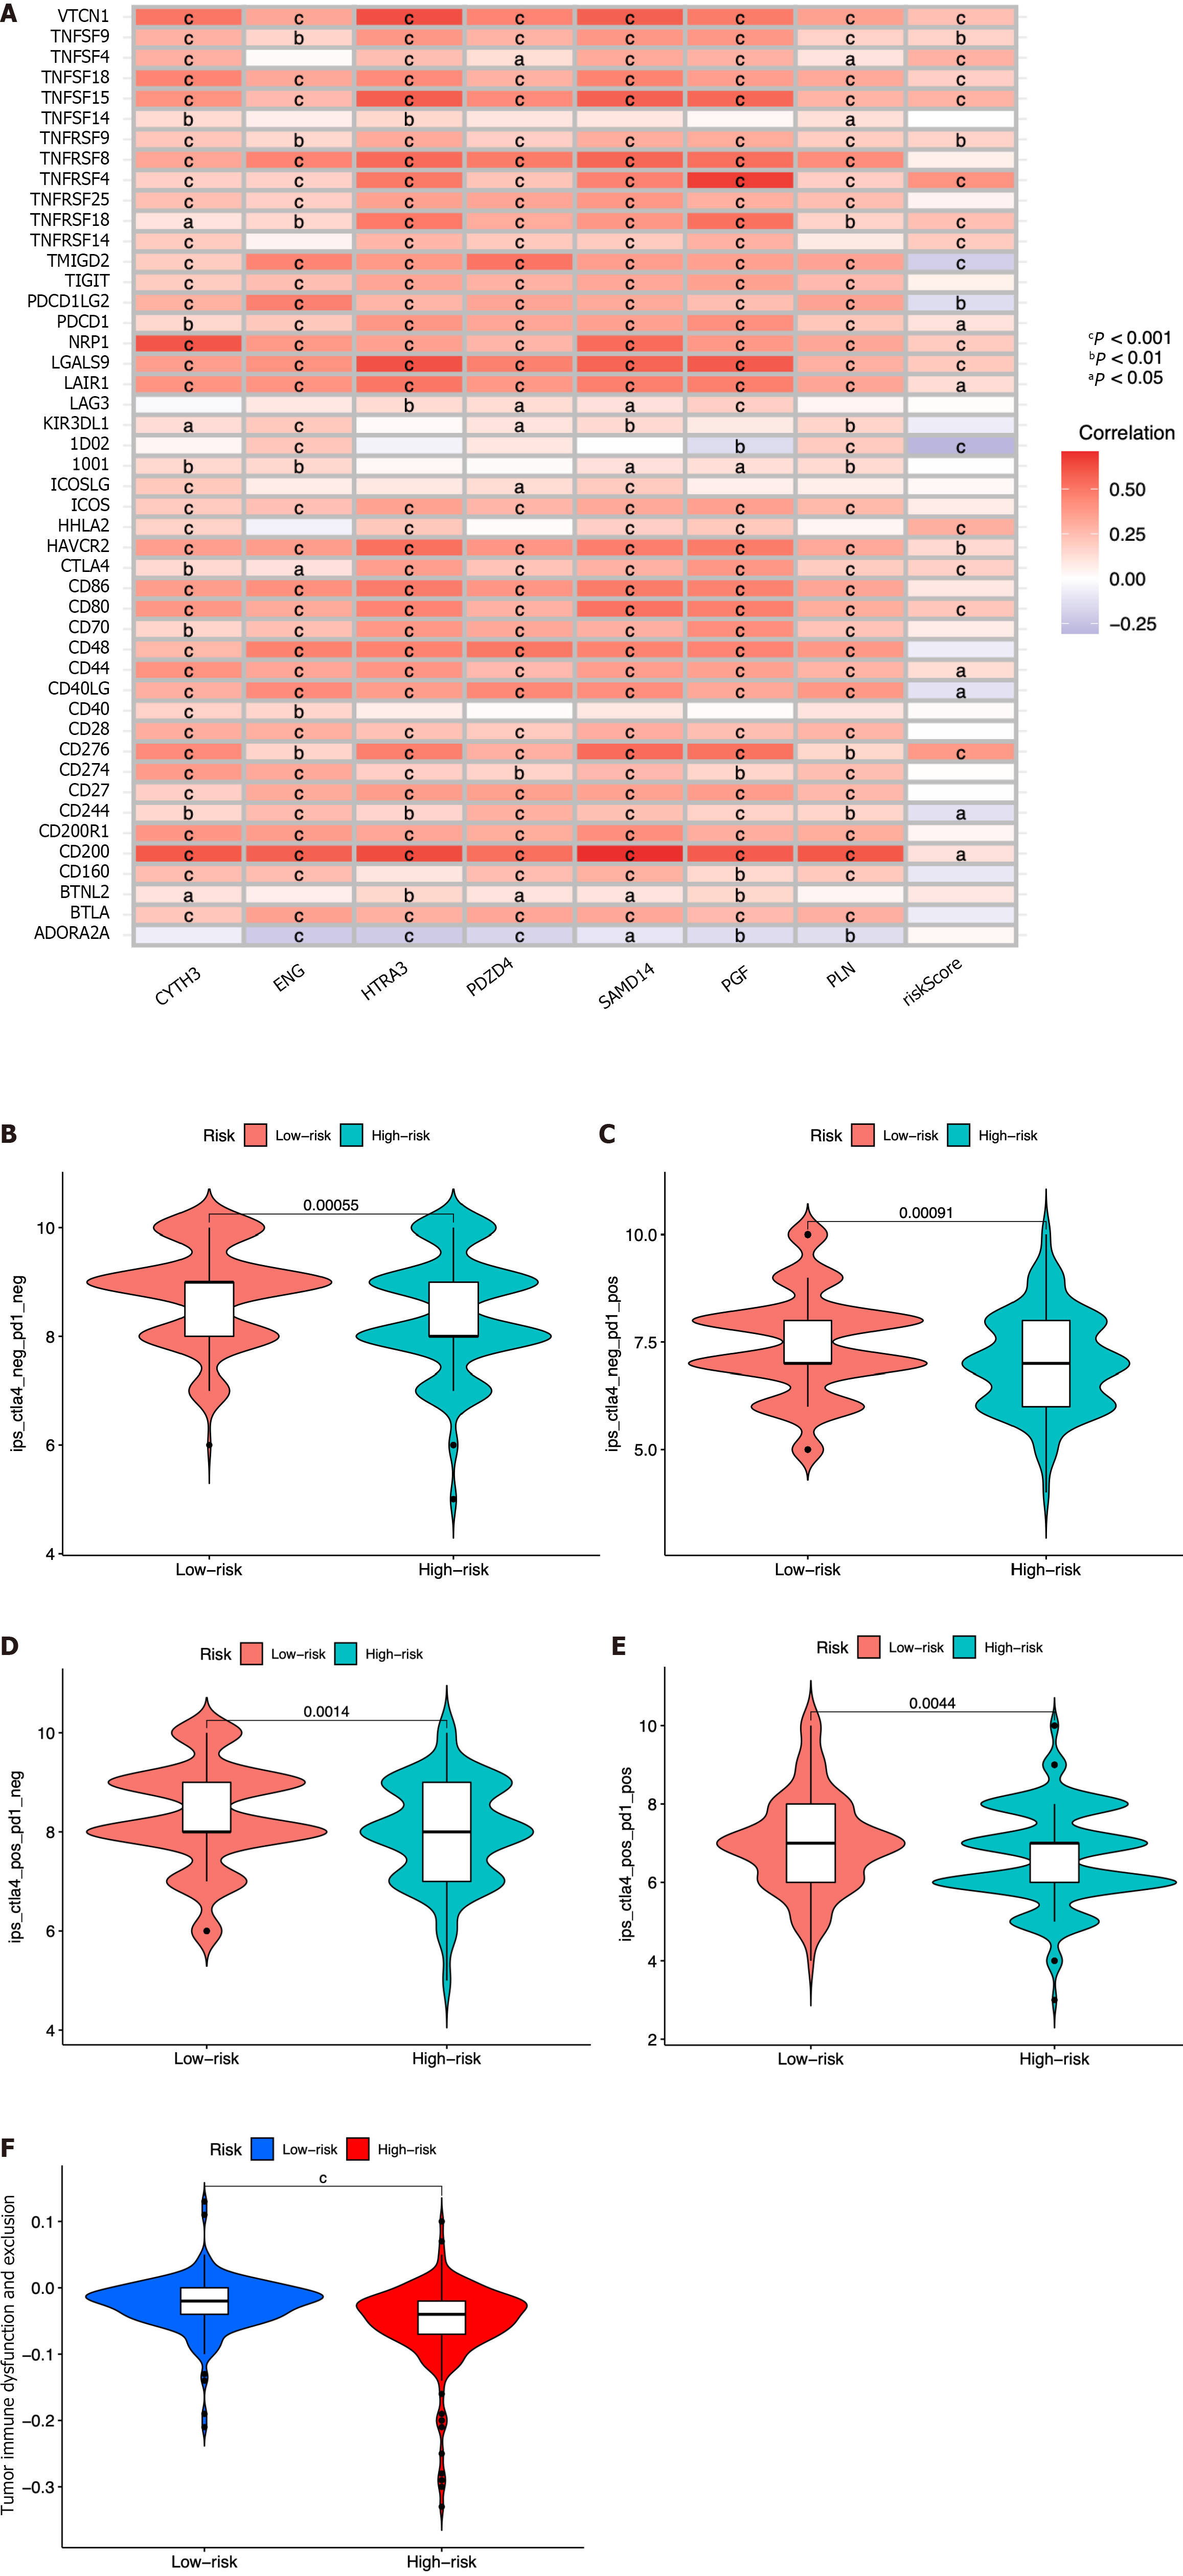
Figure 9 Immune-check point analysis of the seven identified immune cell-related genes and immune checkpoint blockade.
A: Heatmap of association among 47 immune checkpoints, risk score, and the seven identified immune cell-related genes; B-E: Association between the tumor microenvironment and risk score; F: Violin plot showing the relationship of tumor immune dysfunction and risk score between the low- and high-risk groups. cP < 0.001, bP < 0.01, aP < 0.05.
- Citation: Li MT, Zheng KF, Qiu YE. Identification of immune cell-related prognostic genes characterized by a distinct microenvironment in hepatocellular carcinoma. World J Clin Oncol 2024; 15(2): 243-270
- URL: https://www.wjgnet.com/2218-4333/full/v15/i2/243.htm
- DOI: https://dx.doi.org/10.5306/wjco.v15.i2.243


