Copyright
©The Author(s) 2022.
World J Clin Oncol. Jul 24, 2022; 13(7): 616-629
Published online Jul 24, 2022. doi: 10.5306/wjco.v13.i7.616
Published online Jul 24, 2022. doi: 10.5306/wjco.v13.i7.616
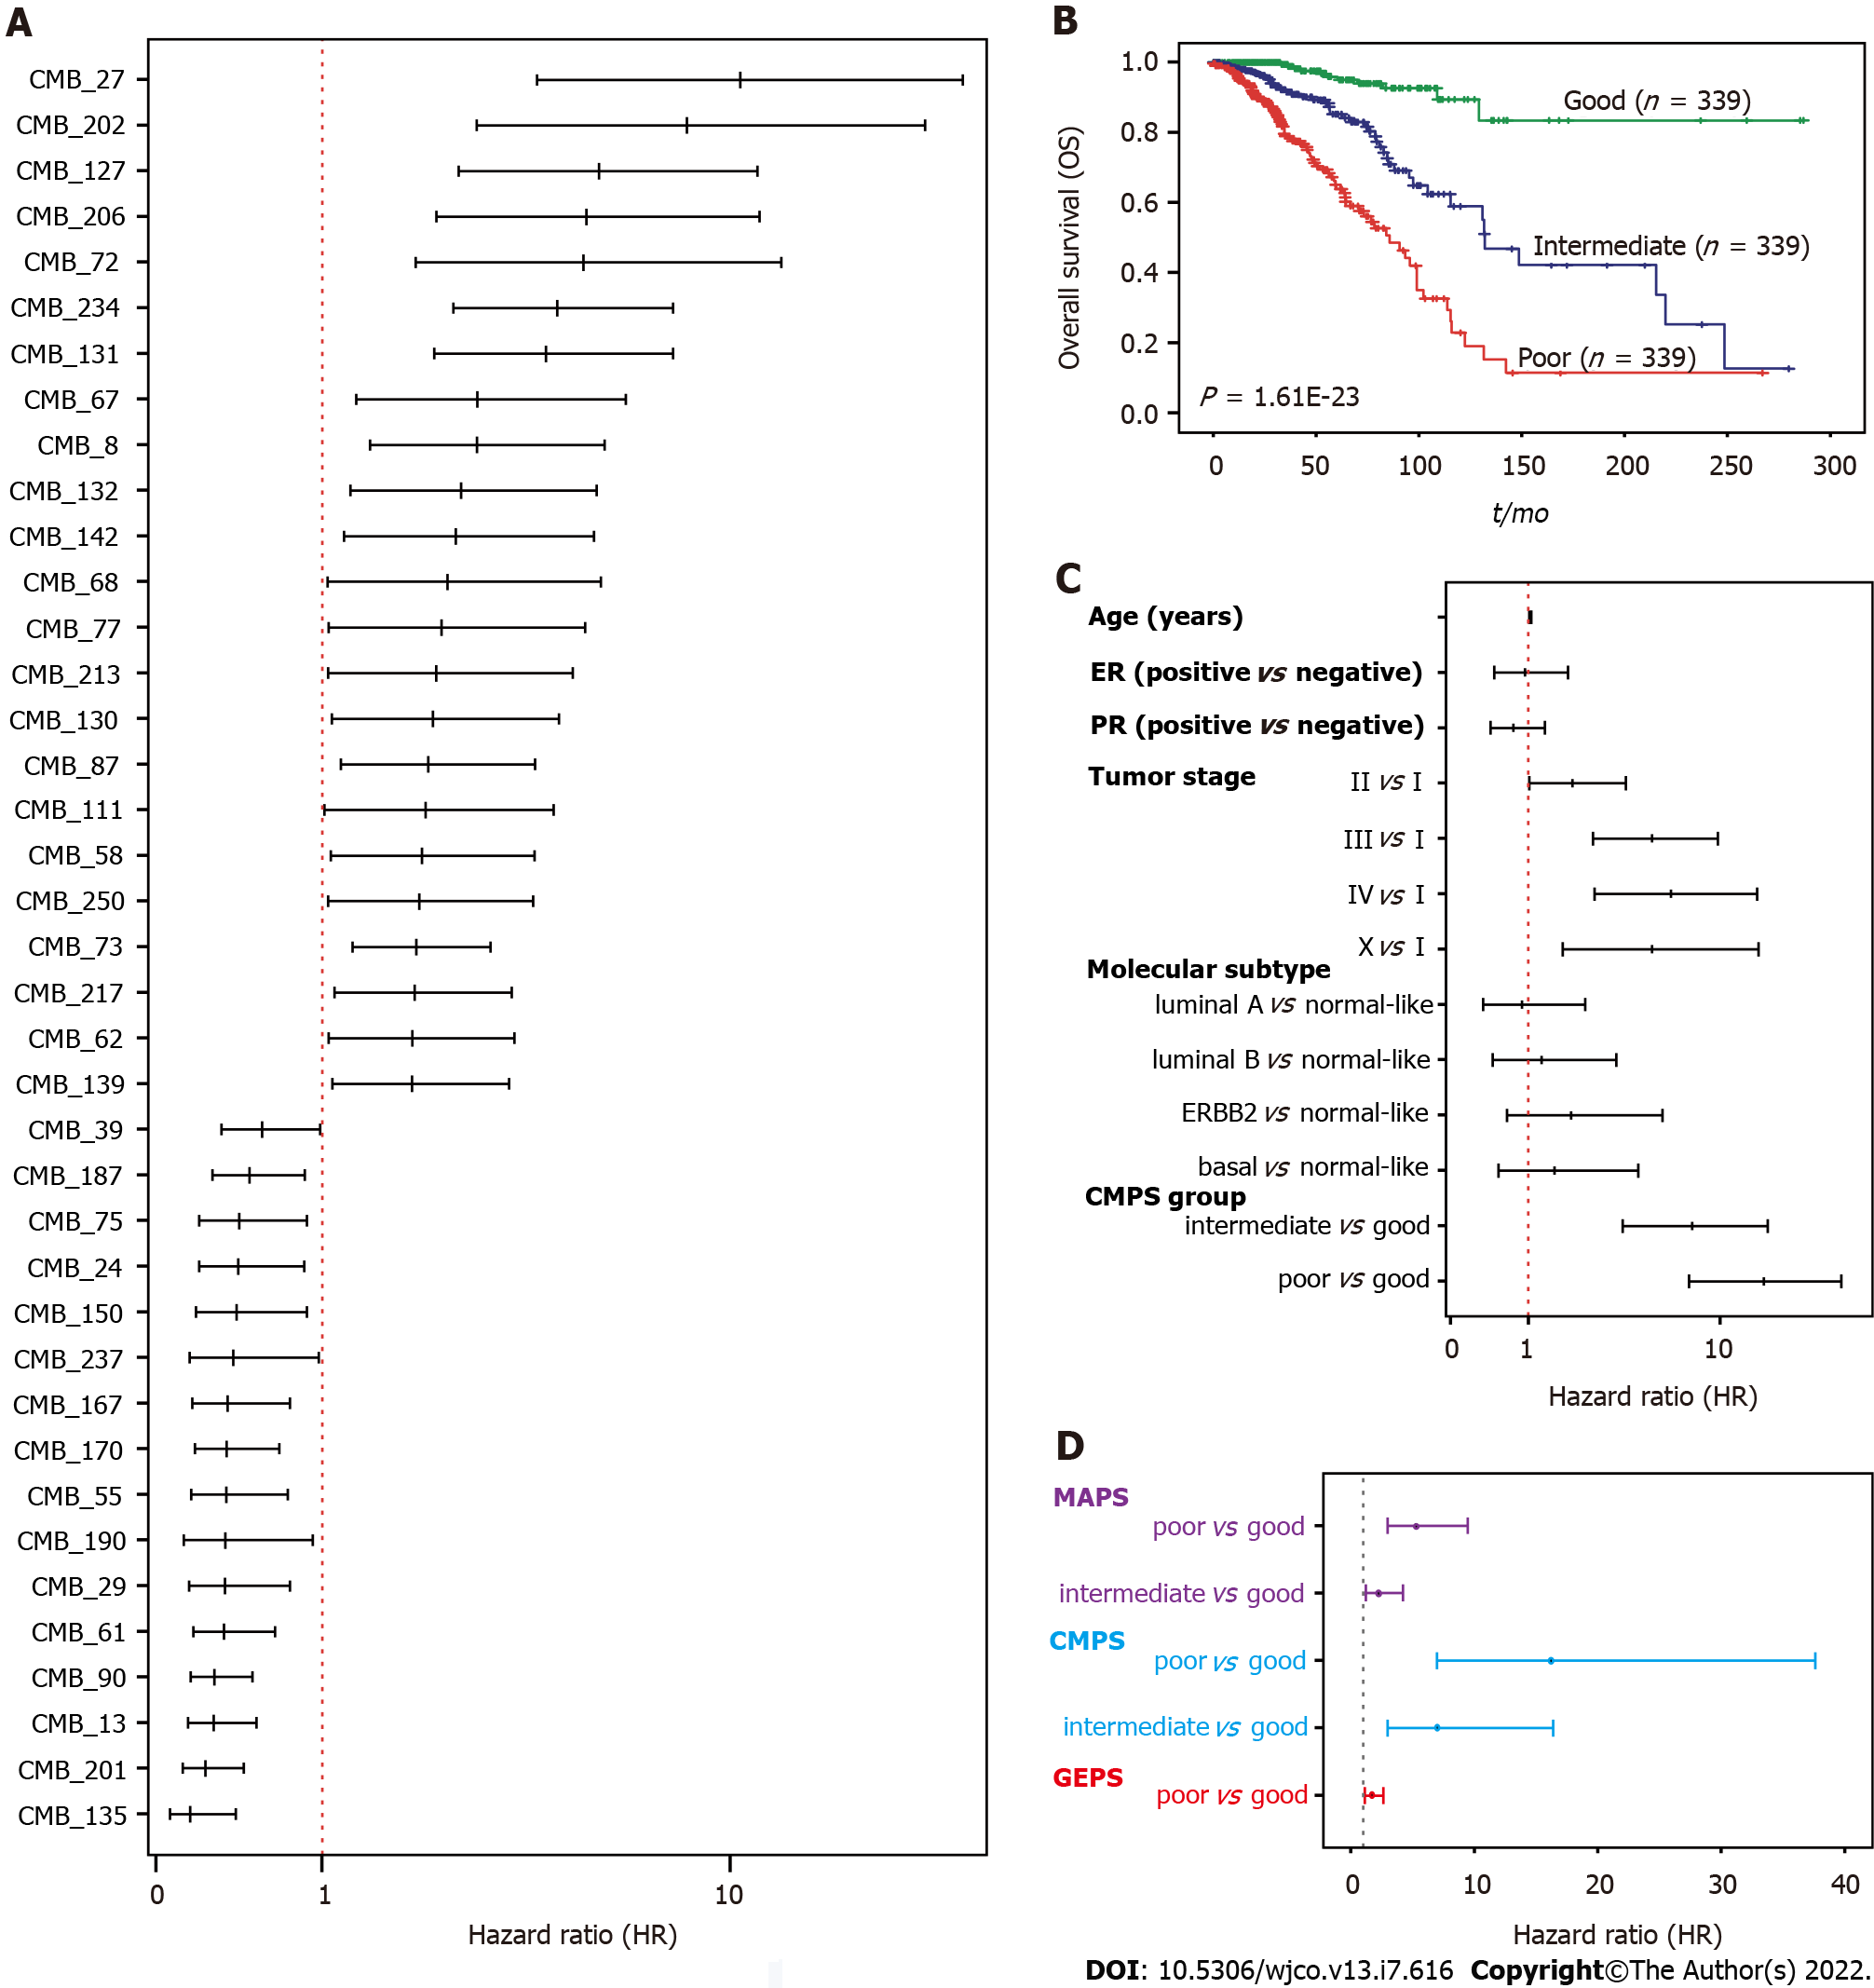
Figure 2 Prognostic value of the cellular morphometric biomarker signature.
A: Multivariate Cox regression analysis with the hazard ratio (HR) represented as a forest plot for cellular morphometric biomarkers; B: Kaplan-Meier curves on overall survival for breast cancer patients are presented with respect to the cellular morphometric prognosis score (CMPS) groups; C: Multivariate Cox regression analysis with hazard ratio (HR) represented as a forest for CMPS groups, clinical factors, and PAM50 subtypes; D: Multivariate Cox regression analysis with the HR represented as a forest plot for CMPS, MAPS, and GEPS.
- Citation: Mao XY, Perez-Losada J, Abad M, Rodríguez-González M, Rodríguez CA, Mao JH, Chang H. iCEMIGE: Integration of CEll-morphometrics, MIcrobiome, and GEne biomarker signatures for risk stratification in breast cancers. World J Clin Oncol 2022; 13(7): 616-629
- URL: https://www.wjgnet.com/2218-4333/full/v13/i7/616.htm
- DOI: https://dx.doi.org/10.5306/wjco.v13.i7.616


