Copyright
©The Author(s) 2022.
World J Clin Oncol. Nov 24, 2022; 13(11): 880-895
Published online Nov 24, 2022. doi: 10.5306/wjco.v13.i11.880
Published online Nov 24, 2022. doi: 10.5306/wjco.v13.i11.880
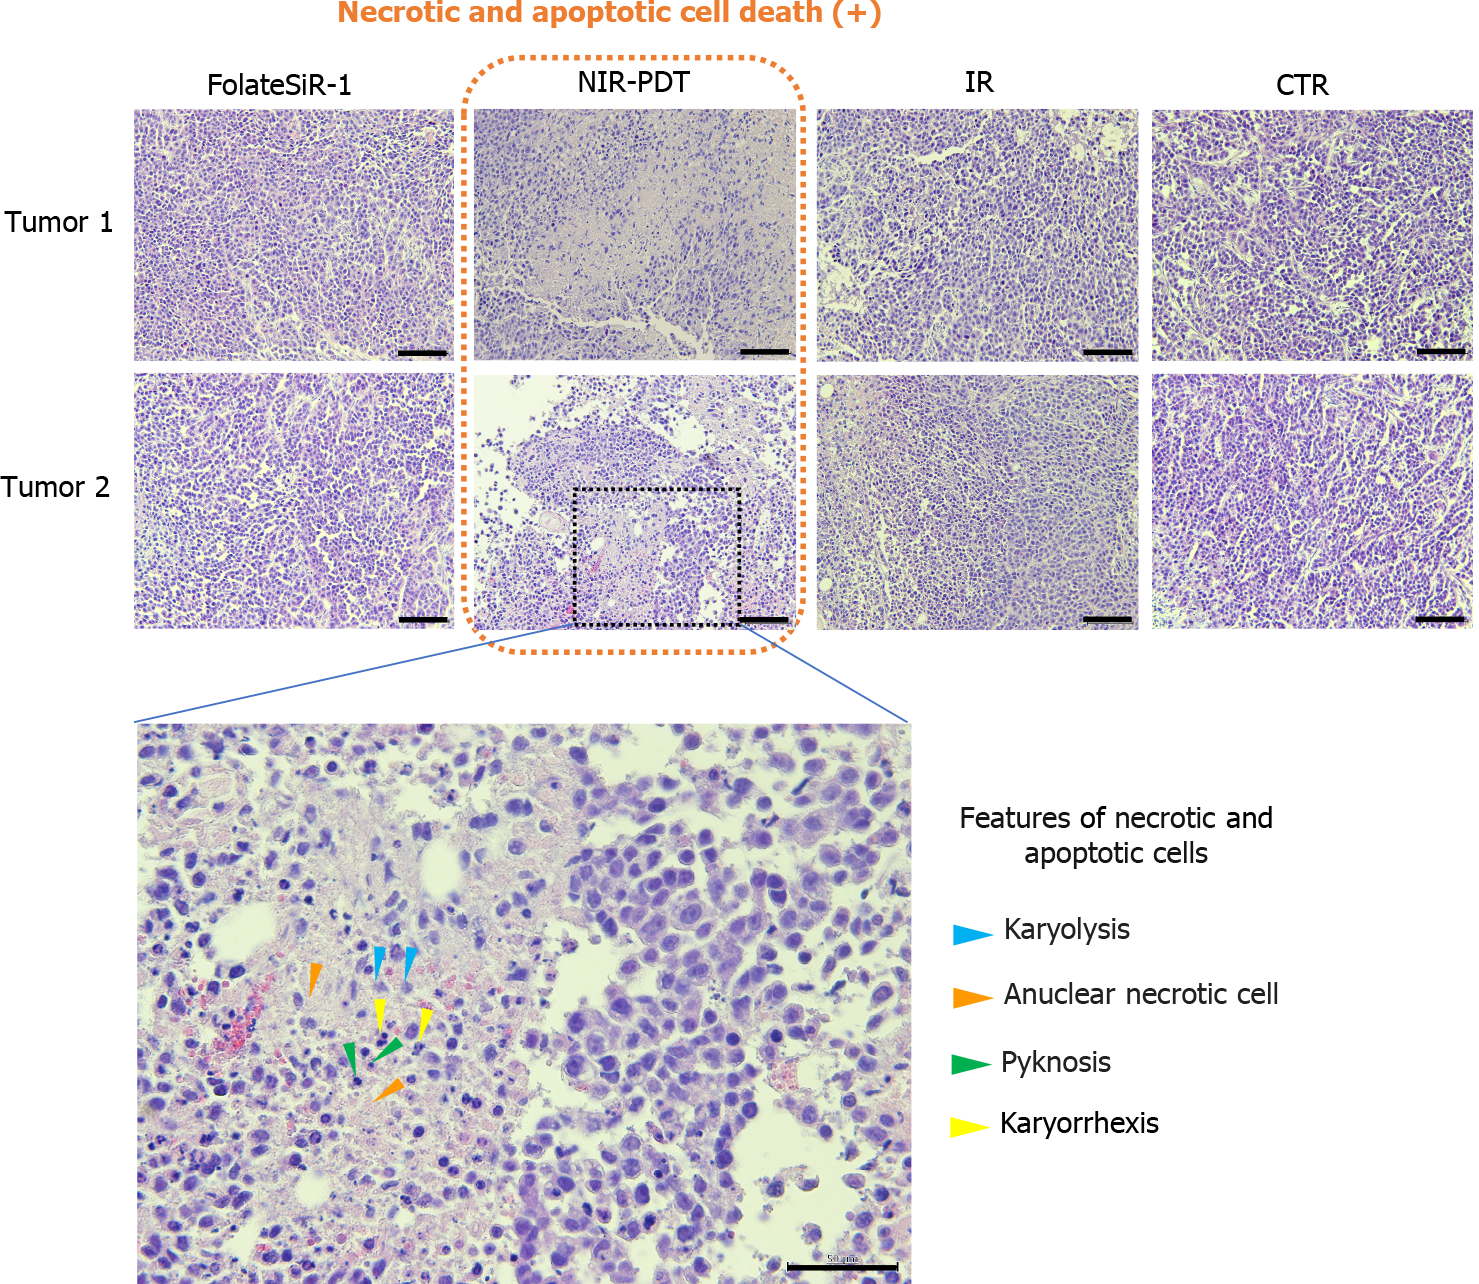
Figure 9 Histological examination of the destructive effects of near-infrared photodynamic therapy in tumor tissues 24 h after near-infrared photodynamic therapy.
Tumors are stained with hematoxylin and eosin. The left lowermost image is a magnification of the indicated portion of the upper image. Some features of necrotic and apoptotic cells are shown with arrowheads: nuclear fading due to DNA loss, karyolysis (blue), anuclear necrotic cells with a glossier homogenous appearance (orange), nuclear chromatin condensation, pyknosis (green), nuclear fragmentation, and karyorrhexis (yellow). (Scale bar = 100 μm, 20 × magnification for upper two rows, and scale bar = 50 μm, 40 × magnification for lower row). FolateSiR-1: folate-Si-rhodamine-1; NIR-PDT: Near-infrared photodynamic therapy; IR: laser irradiation; CTR: control.
- Citation: Aung W, Tsuji AB, Hanaoka K, Higashi T. Folate receptor-targeted near-infrared photodynamic therapy for folate receptor-overexpressing tumors. World J Clin Oncol 2022; 13(11): 880-895
- URL: https://www.wjgnet.com/2218-4333/full/v13/i11/880.htm
- DOI: https://dx.doi.org/10.5306/wjco.v13.i11.880


