Copyright
©The Author(s) 2022.
World J Clin Oncol. Nov 24, 2022; 13(11): 880-895
Published online Nov 24, 2022. doi: 10.5306/wjco.v13.i11.880
Published online Nov 24, 2022. doi: 10.5306/wjco.v13.i11.880
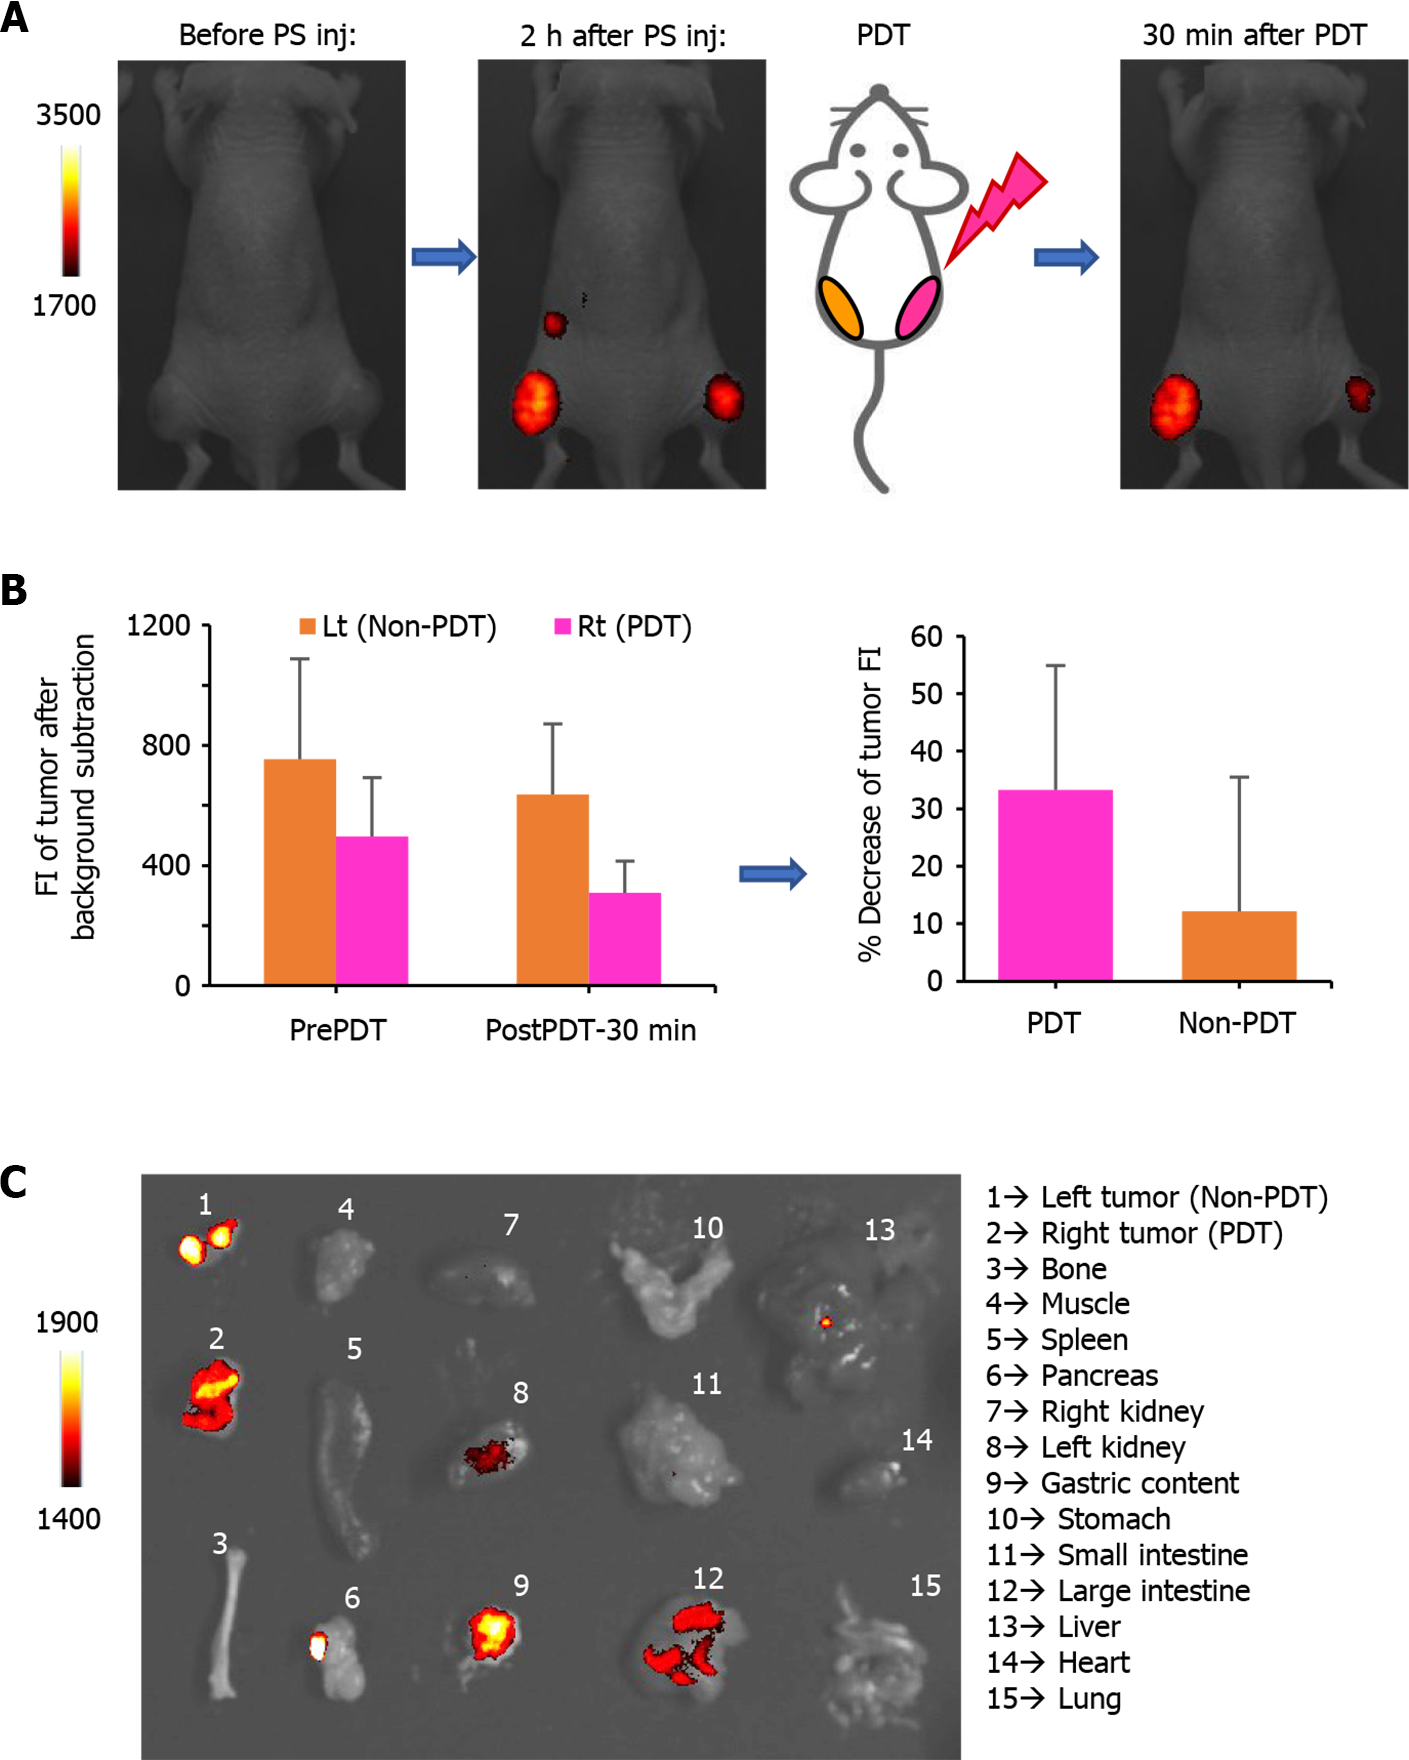
Figure 5 In vivo and ex vivo images before and after photodynamic therapy.
A: Near-infrared fluorescence images of representative tumor bearing mice: before photosensitizer (PS) (FolateSiR-1) injection (left), 2 h after PS injection (center), and 30 min after photodynamic therapy (PDT) (right). The right tumor received PDT while the left tumor did not. Fluorescent signal intensity (FI) of the right tumor decreased immediately after PDT, and the extent of FI reduction is larger than that of the left tumor; B: Bar graph showing the FI of the tumor before- and 30 min after PDT. Data are presented as the mean ± SD (n = 4); C: Ex vivo fluorescence images captured 30 min after PDT. NIR: Near-infrared; Lt: Left; Rt: Right; PS inj: photosensitizer injection; PDT: Photodynamic therapy; Non-PDT: Without PDT; FI: Fluorescent signal intensity.
- Citation: Aung W, Tsuji AB, Hanaoka K, Higashi T. Folate receptor-targeted near-infrared photodynamic therapy for folate receptor-overexpressing tumors. World J Clin Oncol 2022; 13(11): 880-895
- URL: https://www.wjgnet.com/2218-4333/full/v13/i11/880.htm
- DOI: https://dx.doi.org/10.5306/wjco.v13.i11.880


