Copyright
©The Author(s) 2022.
World J Clin Oncol. Nov 24, 2022; 13(11): 880-895
Published online Nov 24, 2022. doi: 10.5306/wjco.v13.i11.880
Published online Nov 24, 2022. doi: 10.5306/wjco.v13.i11.880
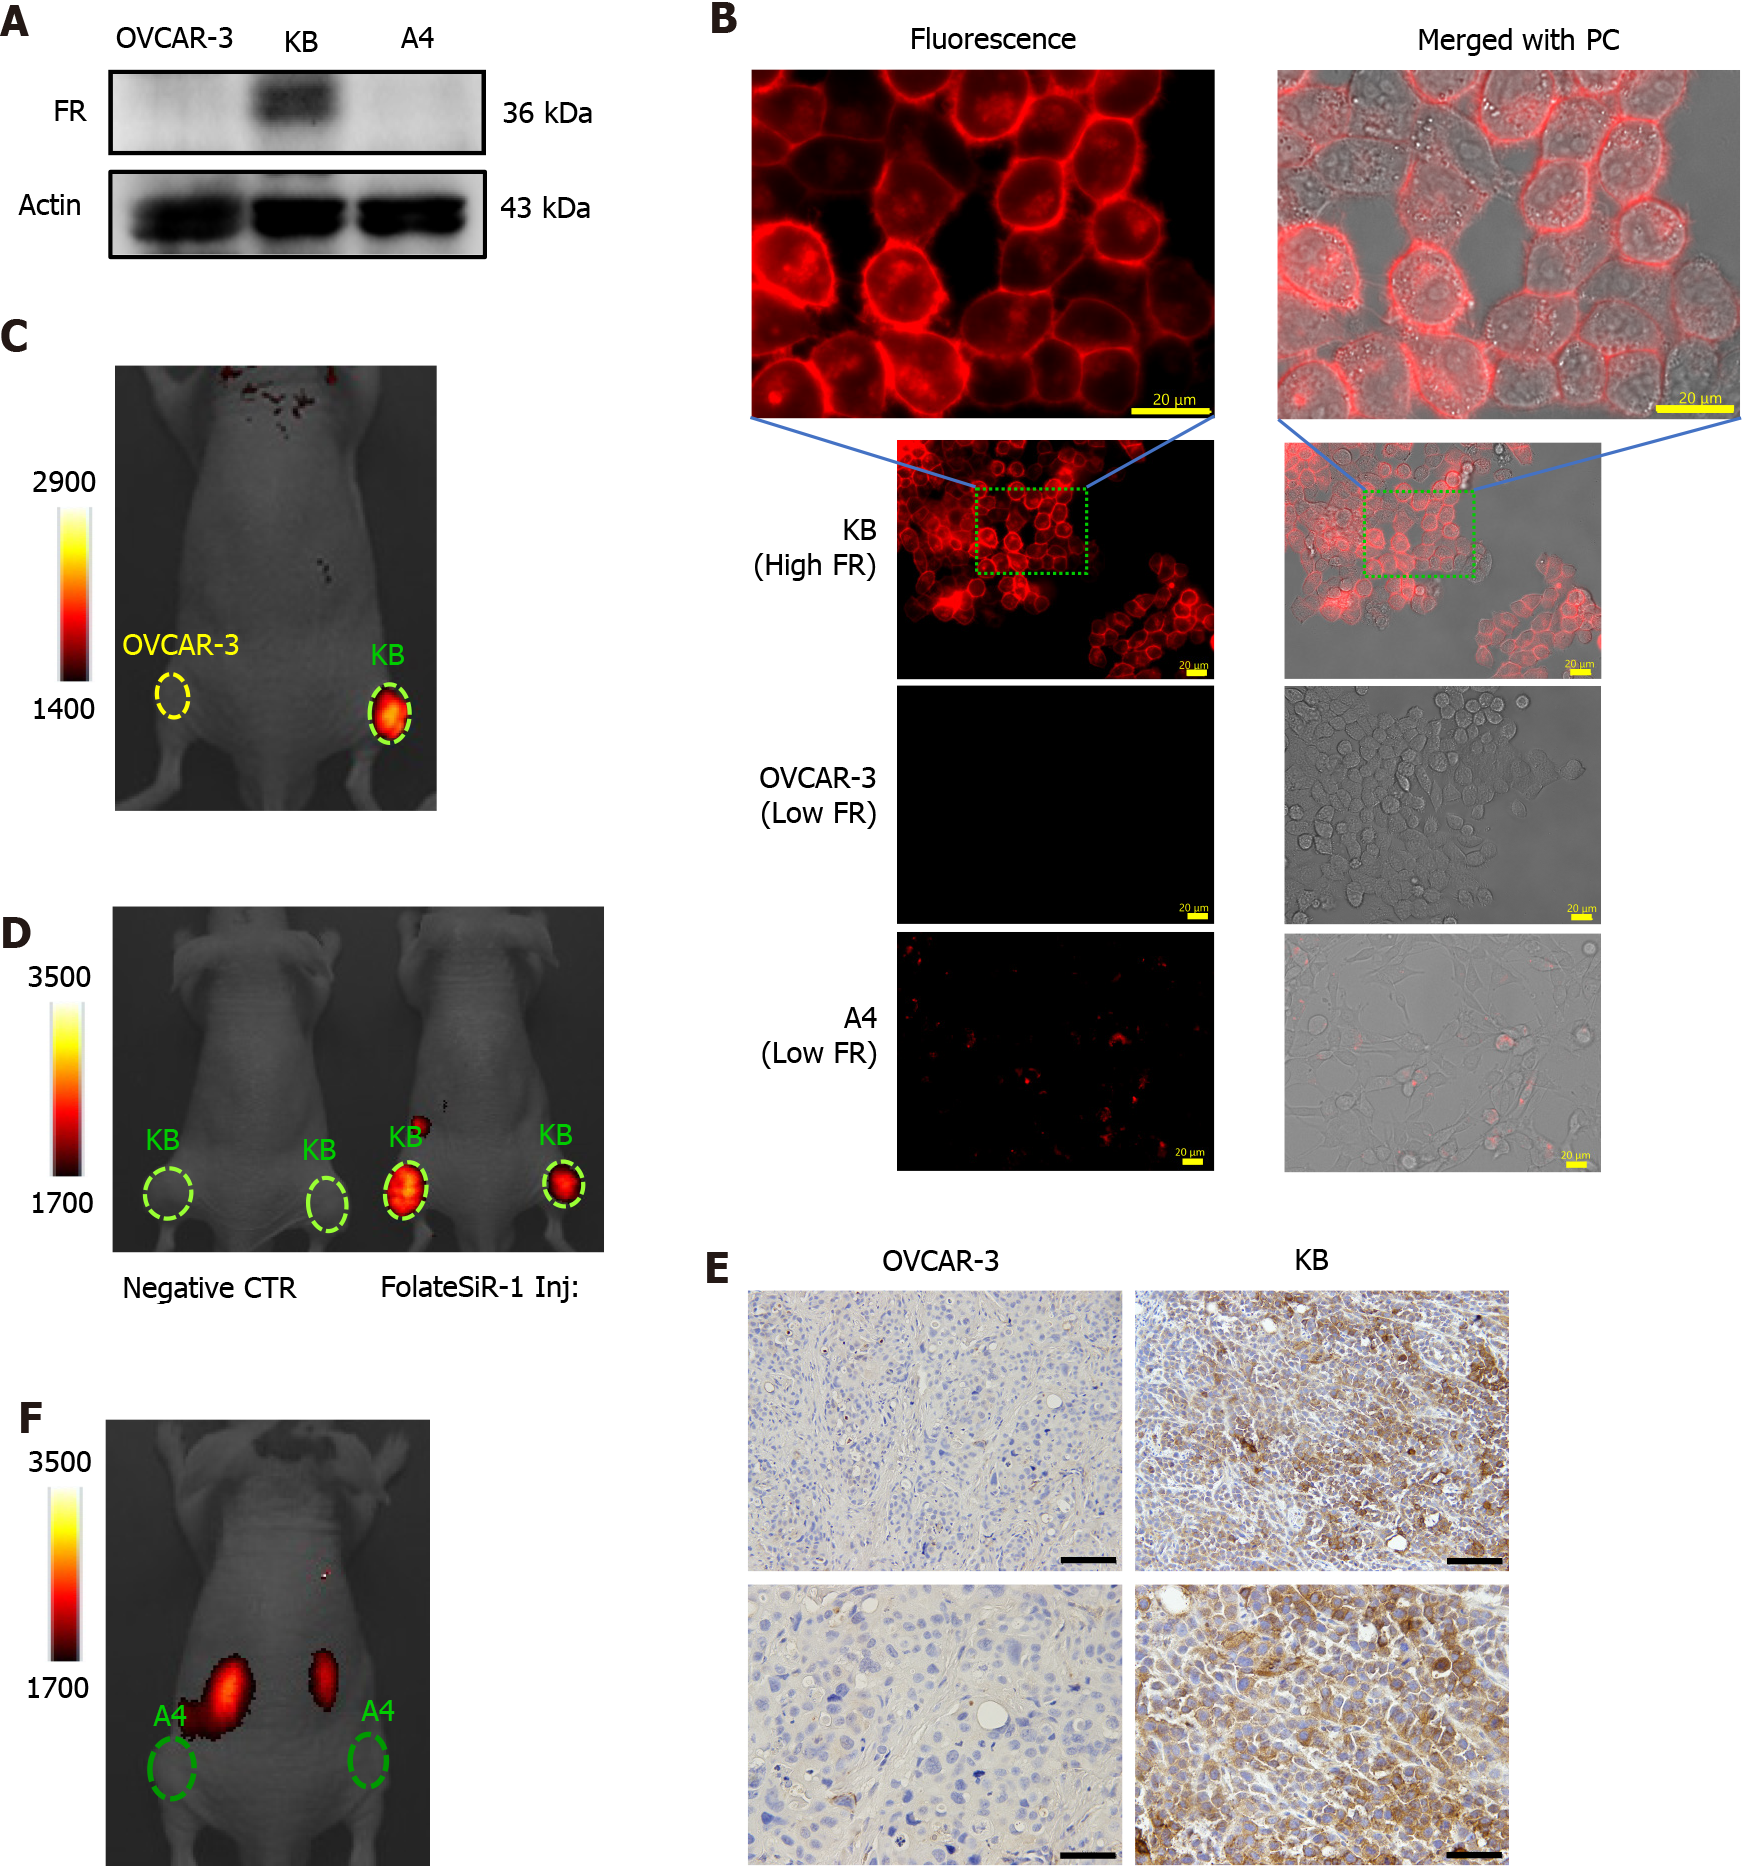
Figure 2 Folate receptor expression in designated cell lines and folate receptor-specific binding of folate-Si-rhodamine-1 in tumor in vivo.
A: Folate receptor (FR) expression in cell lines OVCAR-3, KB, and A4 examined by western blotting; B: Cell lines were incubated with or without folate-Si-rhodamine-1 (FolateSiR-1) for 24 h and examined under a fluorescent microscope. FolateSiR-1 fluorescence was detected using the appropriate filters (Ex/Em 590-650/665-732 nm). The uppermost images are magnifications of the indicated portion of the lower image showing KB cells (scale bar = 20 μm, 40 × magnification, and 120 × magnification for the upper most image); C: Near-infrared (NIR) fluorescence image of a representative mouse bearing subcutaneous KB (right) and OVCAR-3 (left) tumors at 2 h after receiving the FolateSiR-1 injection: KB tumor (FR+) showed high fluorescence signal intensity (FI), and OVCAR-3 tumor (low FR) did not; D: NIR fluorescence image of mice bearing KB tumors: the right mouse received the FolateSiR-1 injection showed FI, while the left mouse did not (negative control tumor) show no FI; E: NIR fluorescence image of a mouse bearing A4 (low FR) tumor showed no FI; F: Immunohistochemical analysis of tumor tissue sections for FR expression: KB tumor (right column), OVCAR-3 tumor (left column). Scale bar = 100 μm, 20 × magnification for upper panel, and scale bar = 50 μm, 40 × magnification, for lower panel. FR: Folate receptor; Ex: Excitation; Em: Emission; FI: Fluorescence signal intensity; FolateSiR-1: Folate-Si-rhodamine-1; PC: Phase-contrast; NIR: Near-infrared; CTR: Control.
- Citation: Aung W, Tsuji AB, Hanaoka K, Higashi T. Folate receptor-targeted near-infrared photodynamic therapy for folate receptor-overexpressing tumors. World J Clin Oncol 2022; 13(11): 880-895
- URL: https://www.wjgnet.com/2218-4333/full/v13/i11/880.htm
- DOI: https://dx.doi.org/10.5306/wjco.v13.i11.880


