Copyright
©The Author(s) 2022.
World J Clin Oncol. Nov 24, 2022; 13(11): 880-895
Published online Nov 24, 2022. doi: 10.5306/wjco.v13.i11.880
Published online Nov 24, 2022. doi: 10.5306/wjco.v13.i11.880
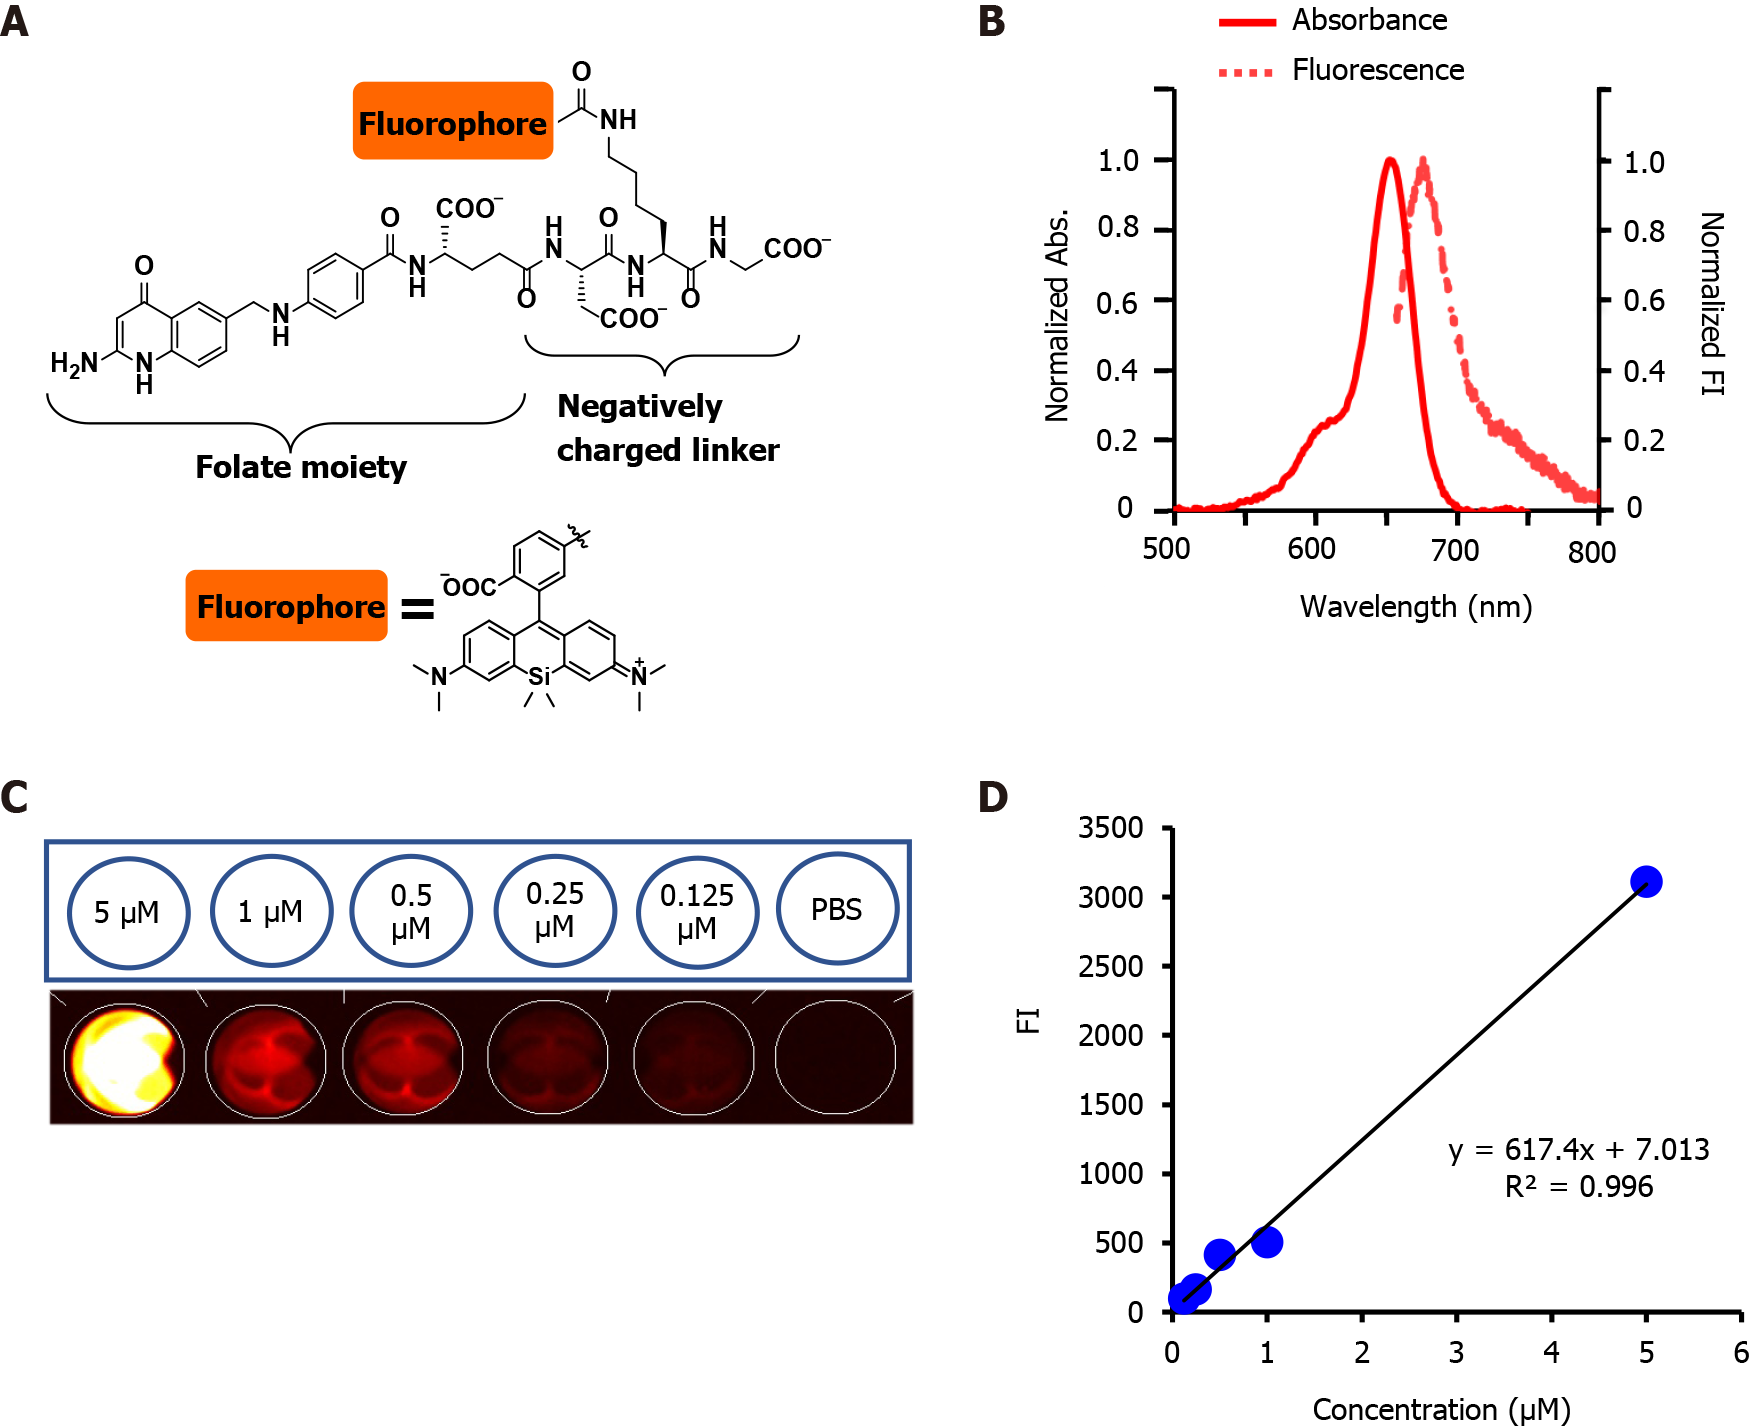
Figure 1 Folate-Si-rhodamine-1 characteristcs.
A: Molecular design and chemical structure of folate-Si-rhodamine-1 (FolateSiR-1); B: Absorption and emission spectra of 1 μmol/L FolateSiR-1 in 100 mmol/L sodium phosphate buffer (pH 7.4) containing 0.1% DMSO: maximum absorption = 652 nm; maximum emission = 674 nm; C: Fluorescence images of FolateSiR-1 at a concentration of 5, 1, 0.5, 0.25, and 0.125 μmol/L in a 96-well plate captured using the VISQUE fluorescence imaging system; D: FolateSiR-1 concentration vs fluorescence signal intensity. Abs: Absorbance; FI: Fluorescence signal intensity; μM: μmol/L.
- Citation: Aung W, Tsuji AB, Hanaoka K, Higashi T. Folate receptor-targeted near-infrared photodynamic therapy for folate receptor-overexpressing tumors. World J Clin Oncol 2022; 13(11): 880-895
- URL: https://www.wjgnet.com/2218-4333/full/v13/i11/880.htm
- DOI: https://dx.doi.org/10.5306/wjco.v13.i11.880


