Copyright
©The Author(s) 2021.
World J Clin Oncol. May 24, 2021; 12(5): 355-366
Published online May 24, 2021. doi: 10.5306/wjco.v12.i5.355
Published online May 24, 2021. doi: 10.5306/wjco.v12.i5.355
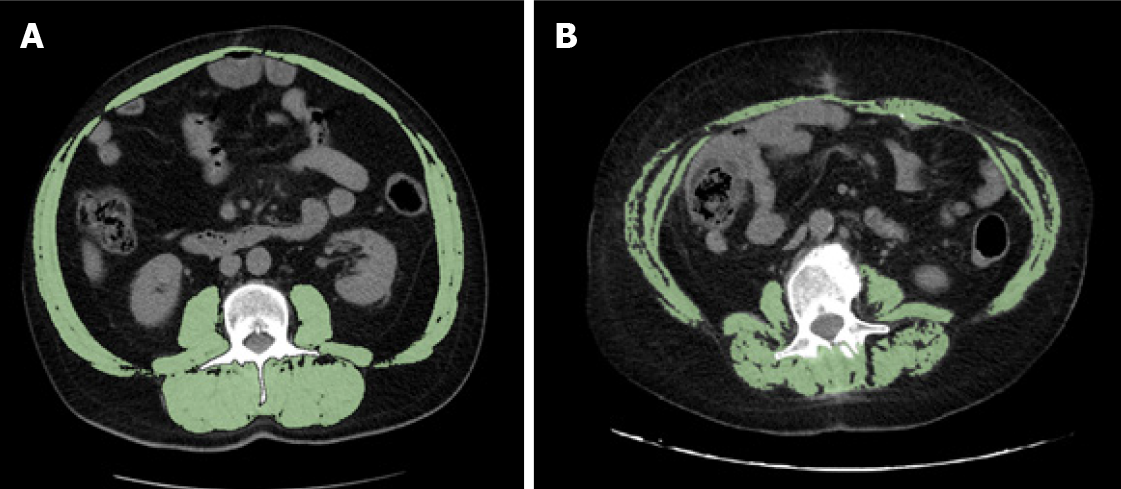
Figure 4 Representative examples of two obese patients with different skeletal mass index values.
A: The patient is a 56-year-old man with body mass index (BMI) = 32.91 kg/m2 and normal skeletal mass index (SMI) value = 62.70 cm2/m2; B: The patient is a 61-year-old woman showing BMI = 32.54 kg/m2 and reduced SMI value = 39.45 cm2/m2.
- Citation: Maddalena C, Ponsiglione A, Camera L, Santarpia L, Pasanisi F, Bruzzese D, Panico C, Fiore G, Camardella S, Caramia T, Farinaro A, De Placido S, Carlomagno C. Prognostic role of sarcopenia in metastatic colorectal cancer patients during first-line chemotherapy: A retrospective study. World J Clin Oncol 2021; 12(5): 355-366
- URL: https://www.wjgnet.com/2218-4333/full/v12/i5/355.htm
- DOI: https://dx.doi.org/10.5306/wjco.v12.i5.355


