Copyright
©The Author(s) 2017.
World J Clin Oncol. Jun 10, 2017; 8(3): 300-304
Published online Jun 10, 2017. doi: 10.5306/wjco.v8.i3.300
Published online Jun 10, 2017. doi: 10.5306/wjco.v8.i3.300
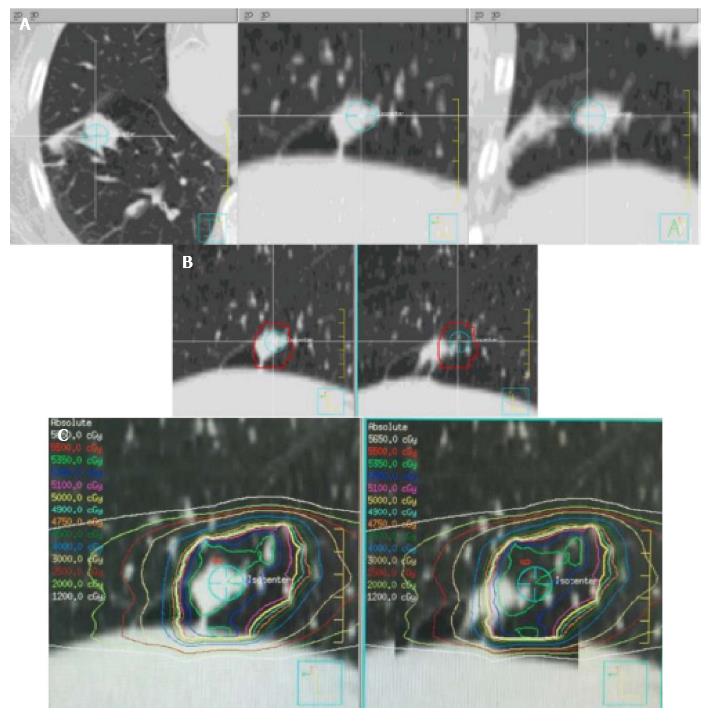
Figure 1 Computed tomography simulation including a four-dimensional and free-breathing computed tomography.
A: Computed tomography (CT) images at simulation (left to right; axial, sagittal, and coronal views) showing the tumor, treatment isocenter, and the adjacent segmental atelectasis (best pictured on coronal image, lateral to isocenter); B: Left panel shows the tumor enclosed within the planning target volume (PTV) on the initial simulation CT; right panel demonstrates the translocation as compared with the original PTV on the re-CT after the first fraction. Sagittal views are shown in both panels; C: Dose distribution of initial (left) and translocated (right) tumor with isodose line values provided on left. Sagittal views are shown in both panels.
- Citation: Mao B, Verma V, Zheng D, Zhu X, Bennion NR, Bhirud AR, Poole MA, Zhen W. Target migration from re-inflation of adjacent atelectasis during lung stereotactic body radiotherapy. World J Clin Oncol 2017; 8(3): 300-304
- URL: https://www.wjgnet.com/2218-4333/full/v8/i3/300.htm
- DOI: https://dx.doi.org/10.5306/wjco.v8.i3.300


