Copyright
©The Author(s) 2017.
World J Clin Oncol. Apr 10, 2017; 8(2): 158-167
Published online Apr 10, 2017. doi: 10.5306/wjco.v8.i2.158
Published online Apr 10, 2017. doi: 10.5306/wjco.v8.i2.158
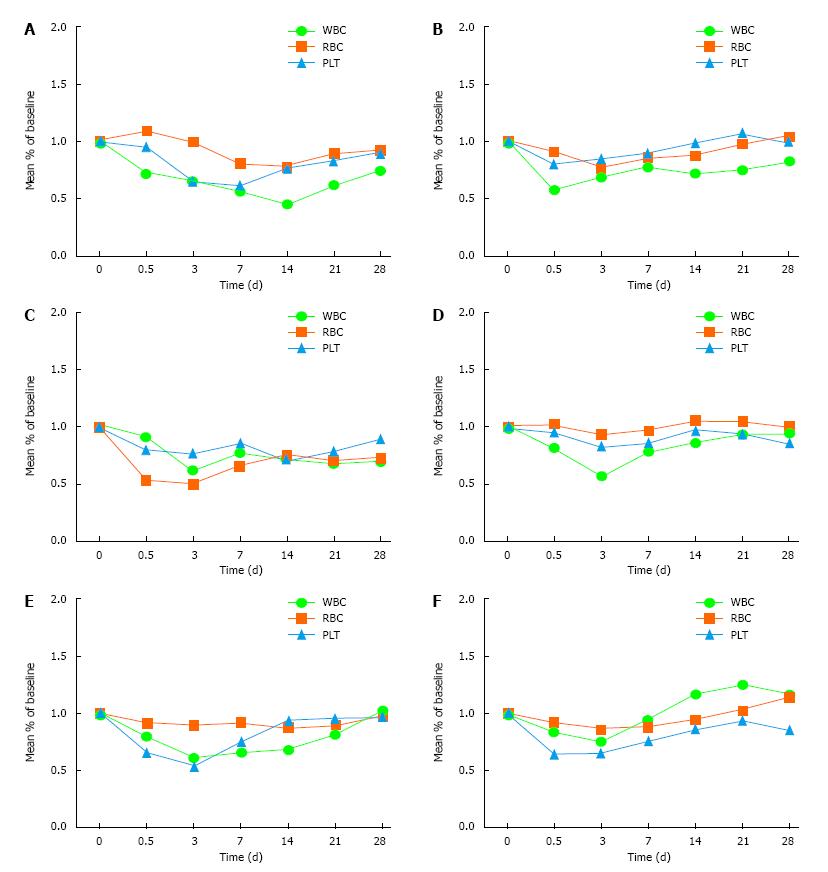
Figure 1 Count changes of the whole blood test.
A: Control group; B: 50 ng/kg subgroup; C: 100 ng/kg subgroup; D: 150 ng/kg subgroup; E: 200 ng/kg subgroup; F: 250 ng/kg subgroup. WBC: White blood cell; RBC: Red blood cell; PLT: Platelet.
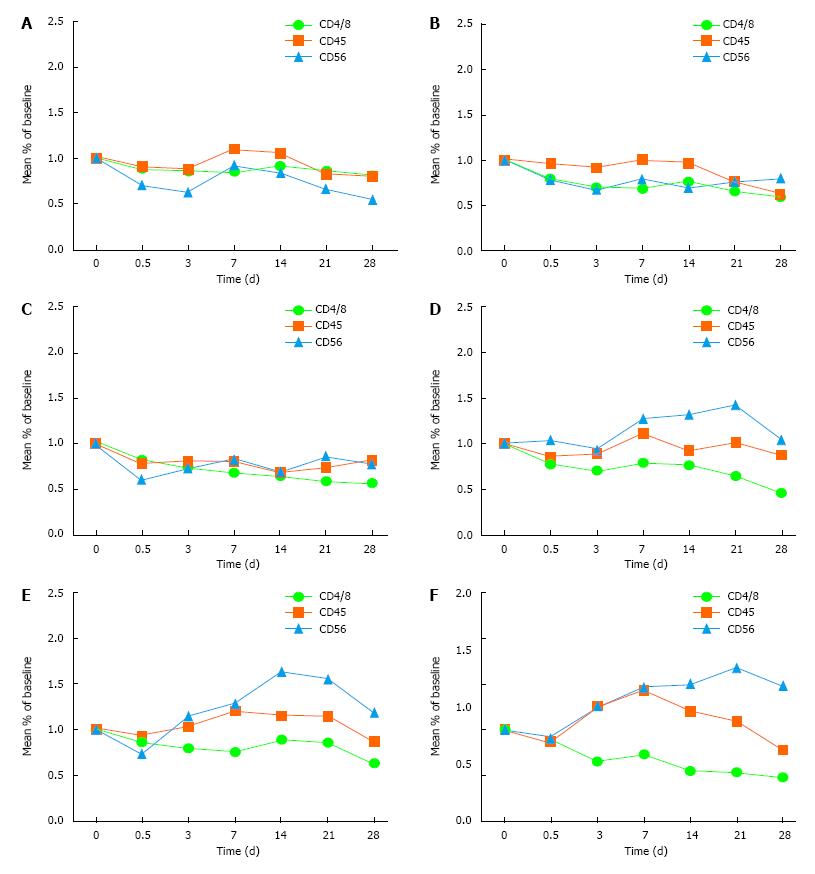
Figure 2 Changes of immune indexes.
A: Control group; B: 50 ng/kg subgroup; C: 100 ng/kg subgroup; D: 150 ng/kg subgroup; E: 200 ng/kg subgroup; F: 250 ng/kg subgroup.
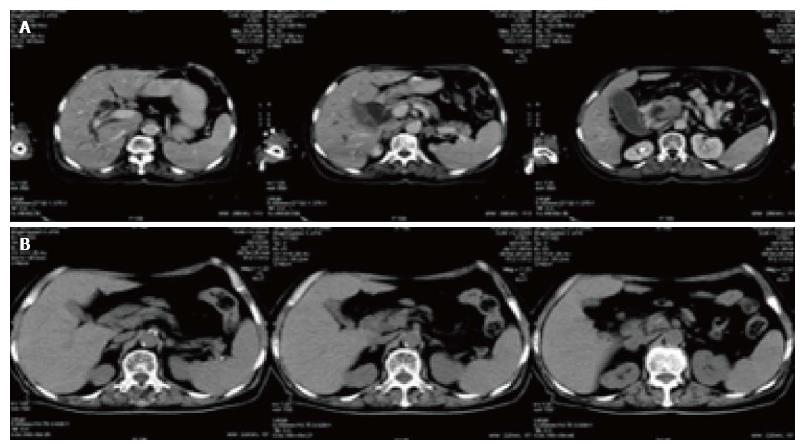
Figure 3 Changes of computed tomography slice before and after treatment in pancreatic cancer patients.
A: Pancreatic head tumor mass (4.4 cm × 3.6 cm × 5.3 cm) accompanied by dilation of intrahepatic and extrahepatic bile duct, pancreatic duct and gallbladder before treatment; B: Most of the pancreatic head mass disappeared in 2 mo after B treatment. Low obstruction disappeared.
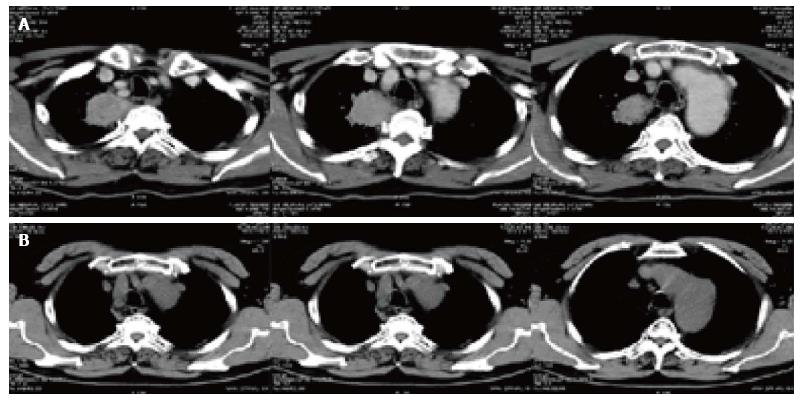
Figure 4 Changes of computed tomography slice before and after treatment in lung cancer patients.
A: Right peripheral lung tumor mass (4.5 cm × 4.8 cm × 4.0 cm) located in the right upper lobe of the right lung before treatment; B: The mass disappeared 1 year after treatment.
- Citation: Guo N, Wang WQ, Gong XJ, Gao L, Yang LR, Yu WN, Shen HY, Wan LQ, Jia XF, Wang YS, Zhao Y. Study of recombinant human interleukin-12 for treatment of complications after radiotherapy for tumor patients. World J Clin Oncol 2017; 8(2): 158-167
- URL: https://www.wjgnet.com/2218-4333/full/v8/i2/158.htm
- DOI: https://dx.doi.org/10.5306/wjco.v8.i2.158


