Copyright
©2011 Baishideng Publishing Group Co.
World J Biol Chem. Jan 26, 2011; 2(1): 14-24
Published online Jan 26, 2011. doi: 10.4331/wjbc.v2.i1.14
Published online Jan 26, 2011. doi: 10.4331/wjbc.v2.i1.14
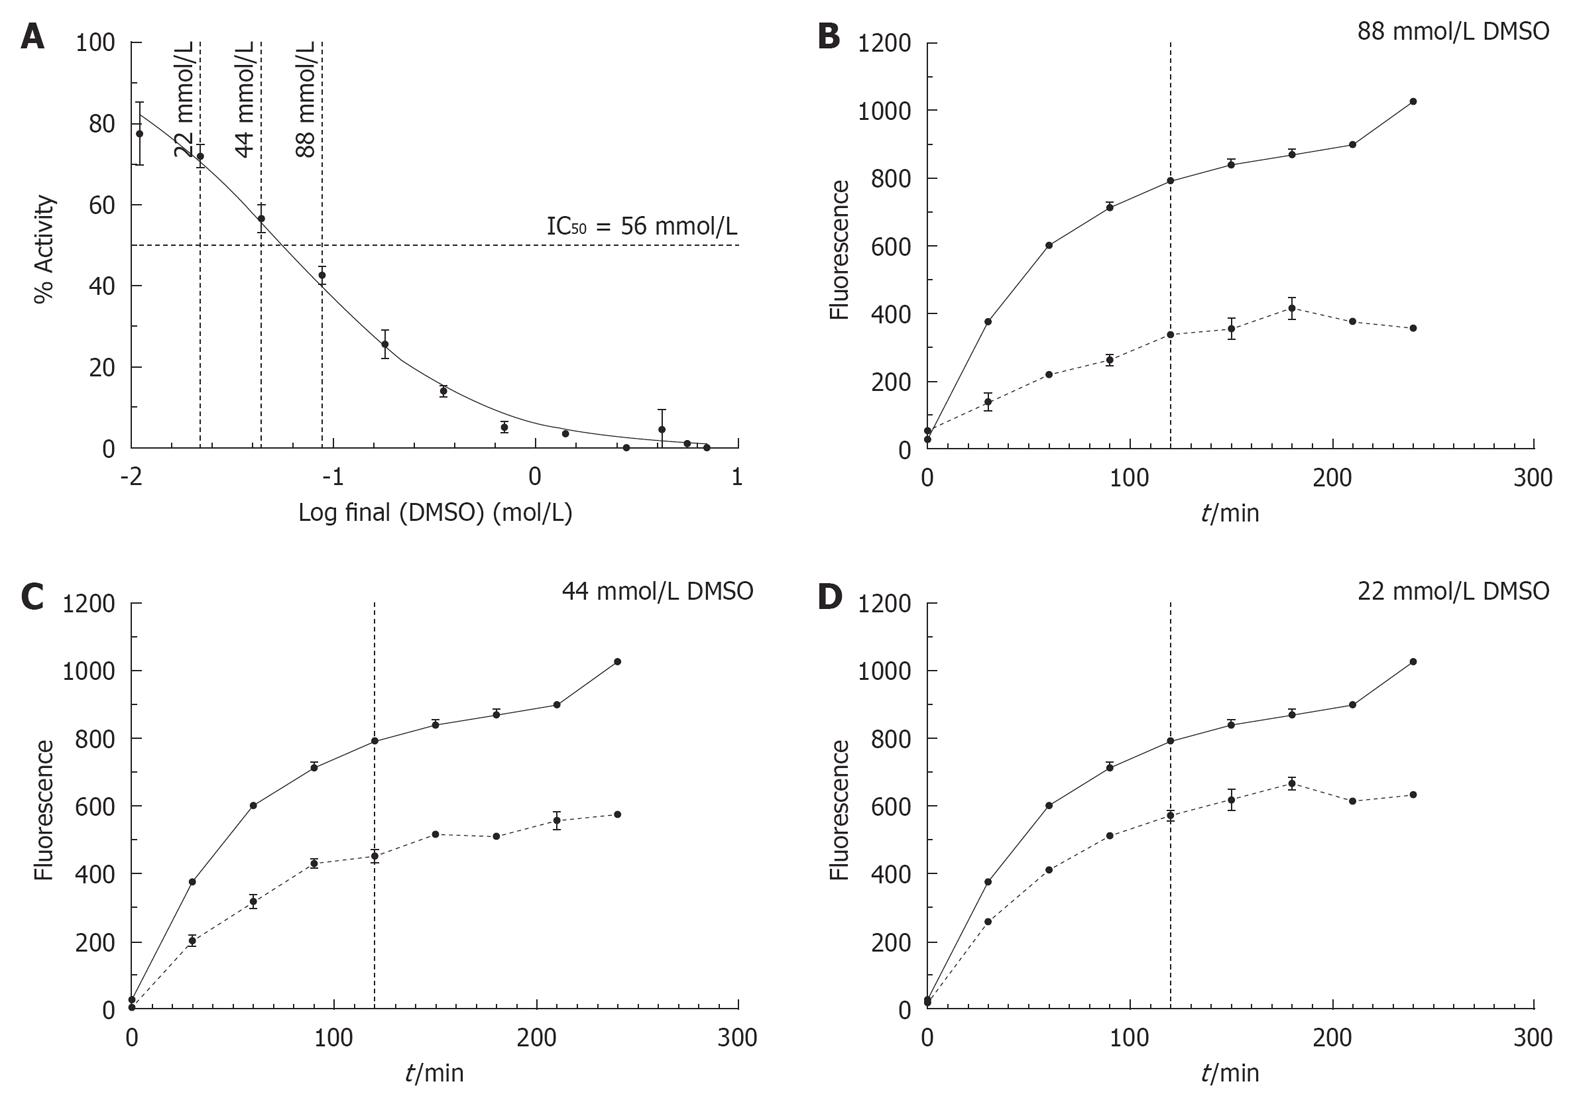
Figure 5 The influence of DMSO on the conversion of DQ™-gelatin into fluorogenic gelatin by matrix metalloproteinase-9.
A: By using a non-linear fit, an IC50 of 56 mmol/L DMSO (R2 = 0.9867) (horizontal dotted line) was determined. The vertical striped lines represent the concentrations used in panels B, C and D; B: Influences of 88 mmol/L (0.6% DMSO), 44 mmol/L (0.3% DMSO) and 22 mmol/L DMSO (0.15% DMSO) on the fluorescence changes at different time points. The solid lines show the fluorescence evolutions measured in the absence of DMSO, the striped lines show the fluorescence measured in the presence of DMSO at the indicated concentrations. The vertical dotted lines represent fluorescence data measured after 2 h.
- Citation: Vandooren J, Geurts N, Martens E, Steen PEVD, Jonghe SD, Herdewijn P, Opdenakker G. Gelatin degradation assay reveals MMP-9 inhibitors and function of O-glycosylated domain. World J Biol Chem 2011; 2(1): 14-24
- URL: https://www.wjgnet.com/1949-8454/full/v2/i1/14.htm
- DOI: https://dx.doi.org/10.4331/wjbc.v2.i1.14


