Copyright
©2011 Baishideng Publishing Group Co.
World J Biol Chem. Jan 26, 2011; 2(1): 14-24
Published online Jan 26, 2011. doi: 10.4331/wjbc.v2.i1.14
Published online Jan 26, 2011. doi: 10.4331/wjbc.v2.i1.14
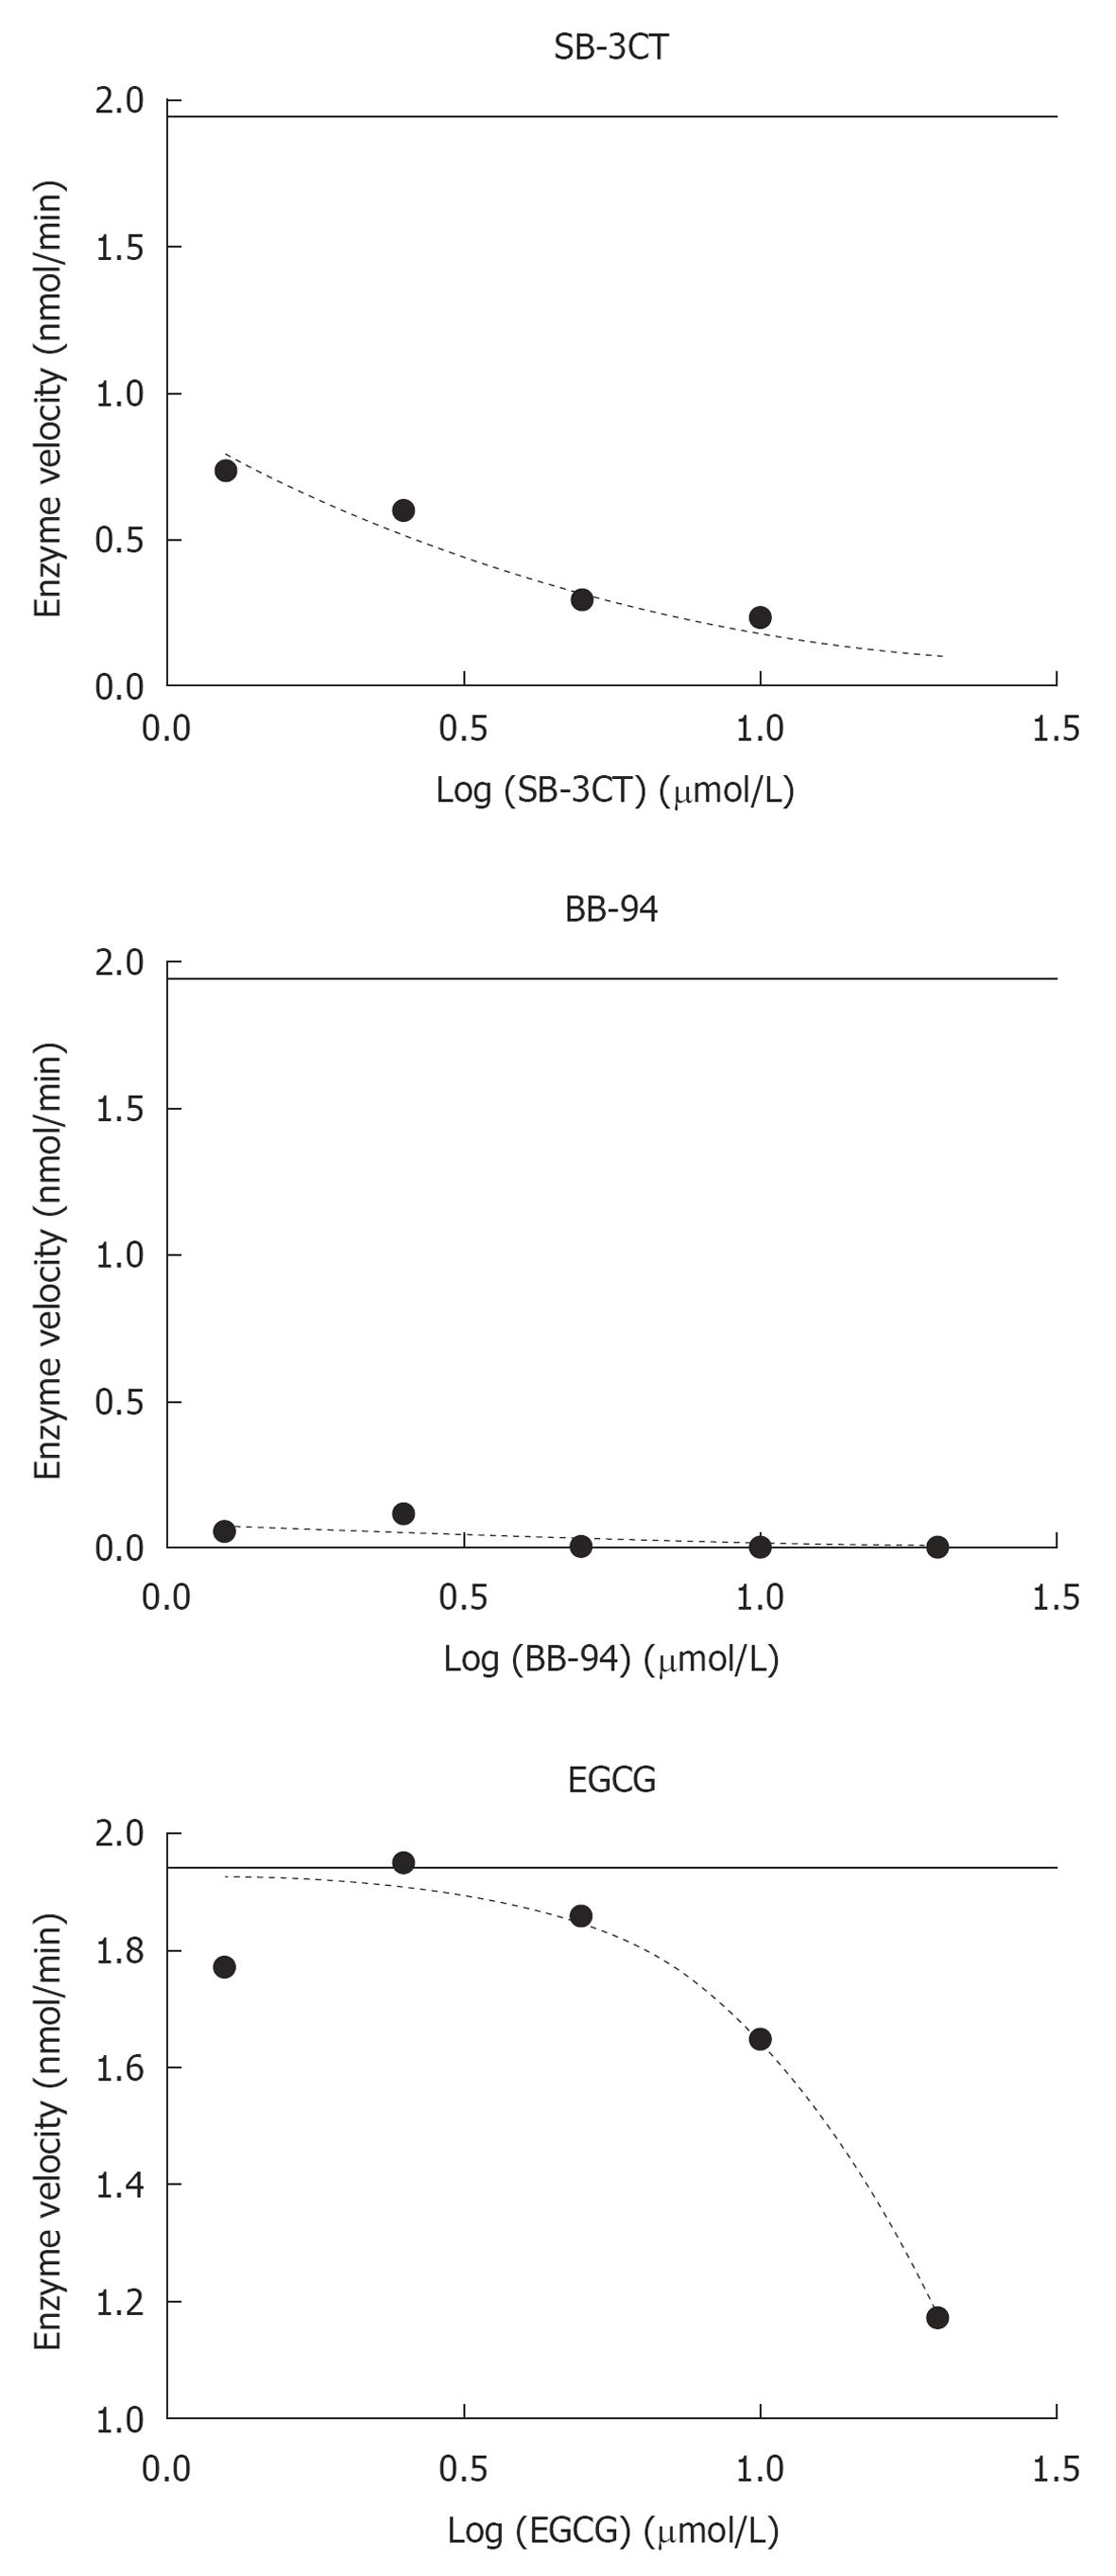
Figure 4 Dose-response curves of the inhibitory activities of SB-3CT, BB-94 and EGCG.
With GraphPad prism software, the IC50 of SB-3CT and BB-94 was predicted to be in the nmol/L range and the IC50 of EGCG in the μmol/L range. The data points correspond to inhibitor concentrations of: 1.25, 2.5, 5, 10 and 20 μmol/L, respectively. The horizontal line shows the enzyme velocity in the absence of inhibitor.
- Citation: Vandooren J, Geurts N, Martens E, Steen PEVD, Jonghe SD, Herdewijn P, Opdenakker G. Gelatin degradation assay reveals MMP-9 inhibitors and function of O-glycosylated domain. World J Biol Chem 2011; 2(1): 14-24
- URL: https://www.wjgnet.com/1949-8454/full/v2/i1/14.htm
- DOI: https://dx.doi.org/10.4331/wjbc.v2.i1.14


