Copyright
©2011 Baishideng Publishing Group Co.
World J Biol Chem. Jan 26, 2011; 2(1): 14-24
Published online Jan 26, 2011. doi: 10.4331/wjbc.v2.i1.14
Published online Jan 26, 2011. doi: 10.4331/wjbc.v2.i1.14
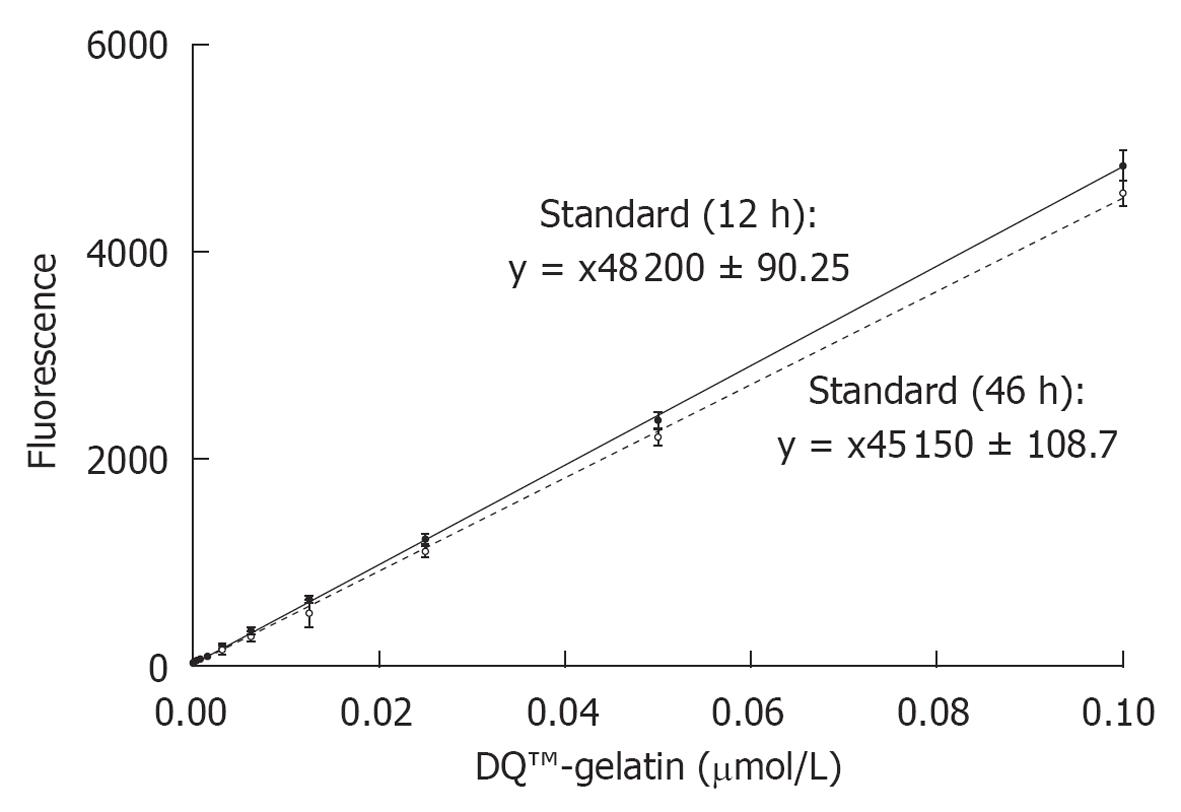
Figure 2 Standard curves of the correlations between fluorescence and product (DQ™-gelatin) concentration.
The full line represents a linear regression of fluorescence data obtained after 12 h incubation. The dashed line represents a linear regression of the fluorescence data obtained after 46 h. The drop in fluorescence was significant (P < 0.05). Data represent mean ± SE (n = 32).
- Citation: Vandooren J, Geurts N, Martens E, Steen PEVD, Jonghe SD, Herdewijn P, Opdenakker G. Gelatin degradation assay reveals MMP-9 inhibitors and function of O-glycosylated domain. World J Biol Chem 2011; 2(1): 14-24
- URL: https://www.wjgnet.com/1949-8454/full/v2/i1/14.htm
- DOI: https://dx.doi.org/10.4331/wjbc.v2.i1.14


