
















©The Author(s) 2025.
World J Biol Chem. Dec 5, 2025; 16(4): 112376
Published online Dec 5, 2025. doi: 10.4331/wjbc.v16.i4.112376
Published online Dec 5, 2025. doi: 10.4331/wjbc.v16.i4.112376
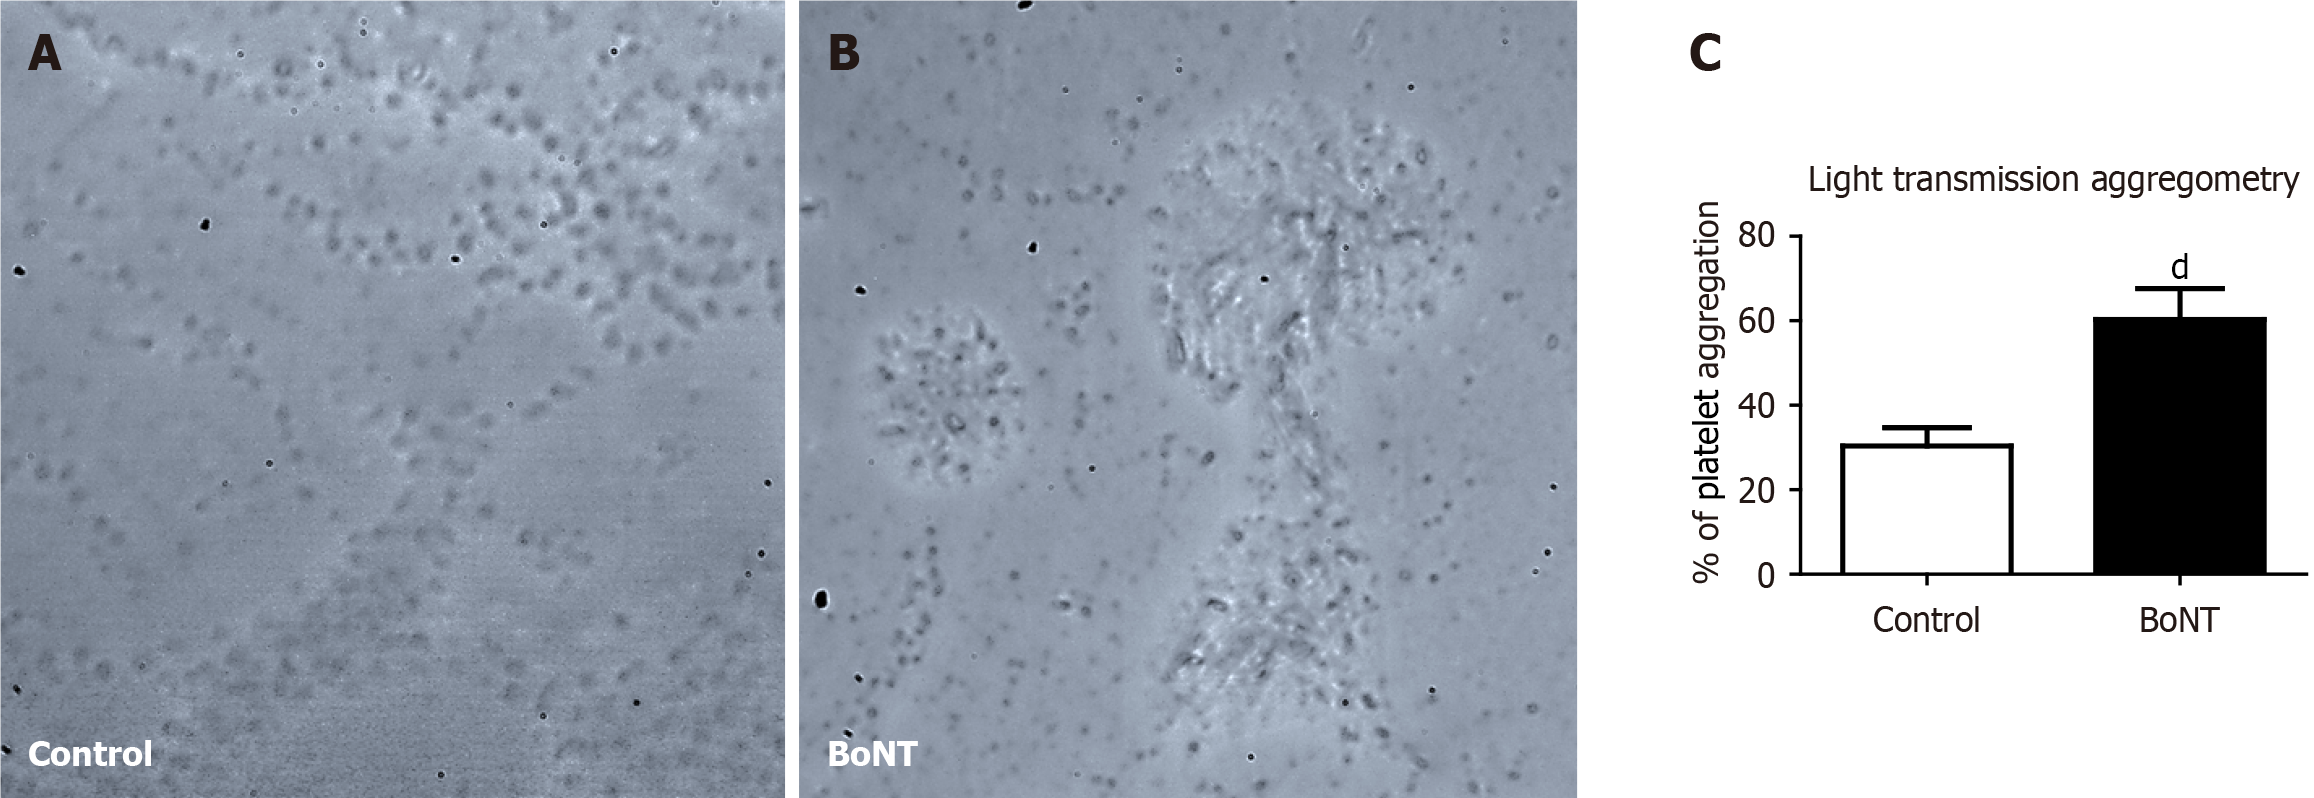
Figure 3 Enhanced platelet aggregation in blood samples of Botulinum toxin-treated mice.
A: Phase contrast microscopic images of aggregation of platelets obtained from platelet-rich plasma (PRP) of control; B: Phase contrast microscopic images of aggregation of platelets obtained from PRP of Botulinum toxin (BoNT)-treated animals; C: The bar graph data represents the percentage of platelet aggregation in control and BoNT-treated animals. dP value ≤ 0.01. BoNT: Botulinum toxin.
- Citation: Ravichandran S, Joseph JHM, Sellathamby S, Kandasamy M. Intramuscular injection of therapeutic botulinum toxin facilitates blood coagulation in experimental aging mice. World J Biol Chem 2025; 16(4): 112376
- URL: https://www.wjgnet.com/1949-8454/full/v16/i4/112376.htm
- DOI: https://dx.doi.org/10.4331/wjbc.v16.i4.112376