
















©The Author(s) 2025.
World J Biol Chem. Dec 5, 2025; 16(4): 111110
Published online Dec 5, 2025. doi: 10.4331/wjbc.v16.i4.111110
Published online Dec 5, 2025. doi: 10.4331/wjbc.v16.i4.111110
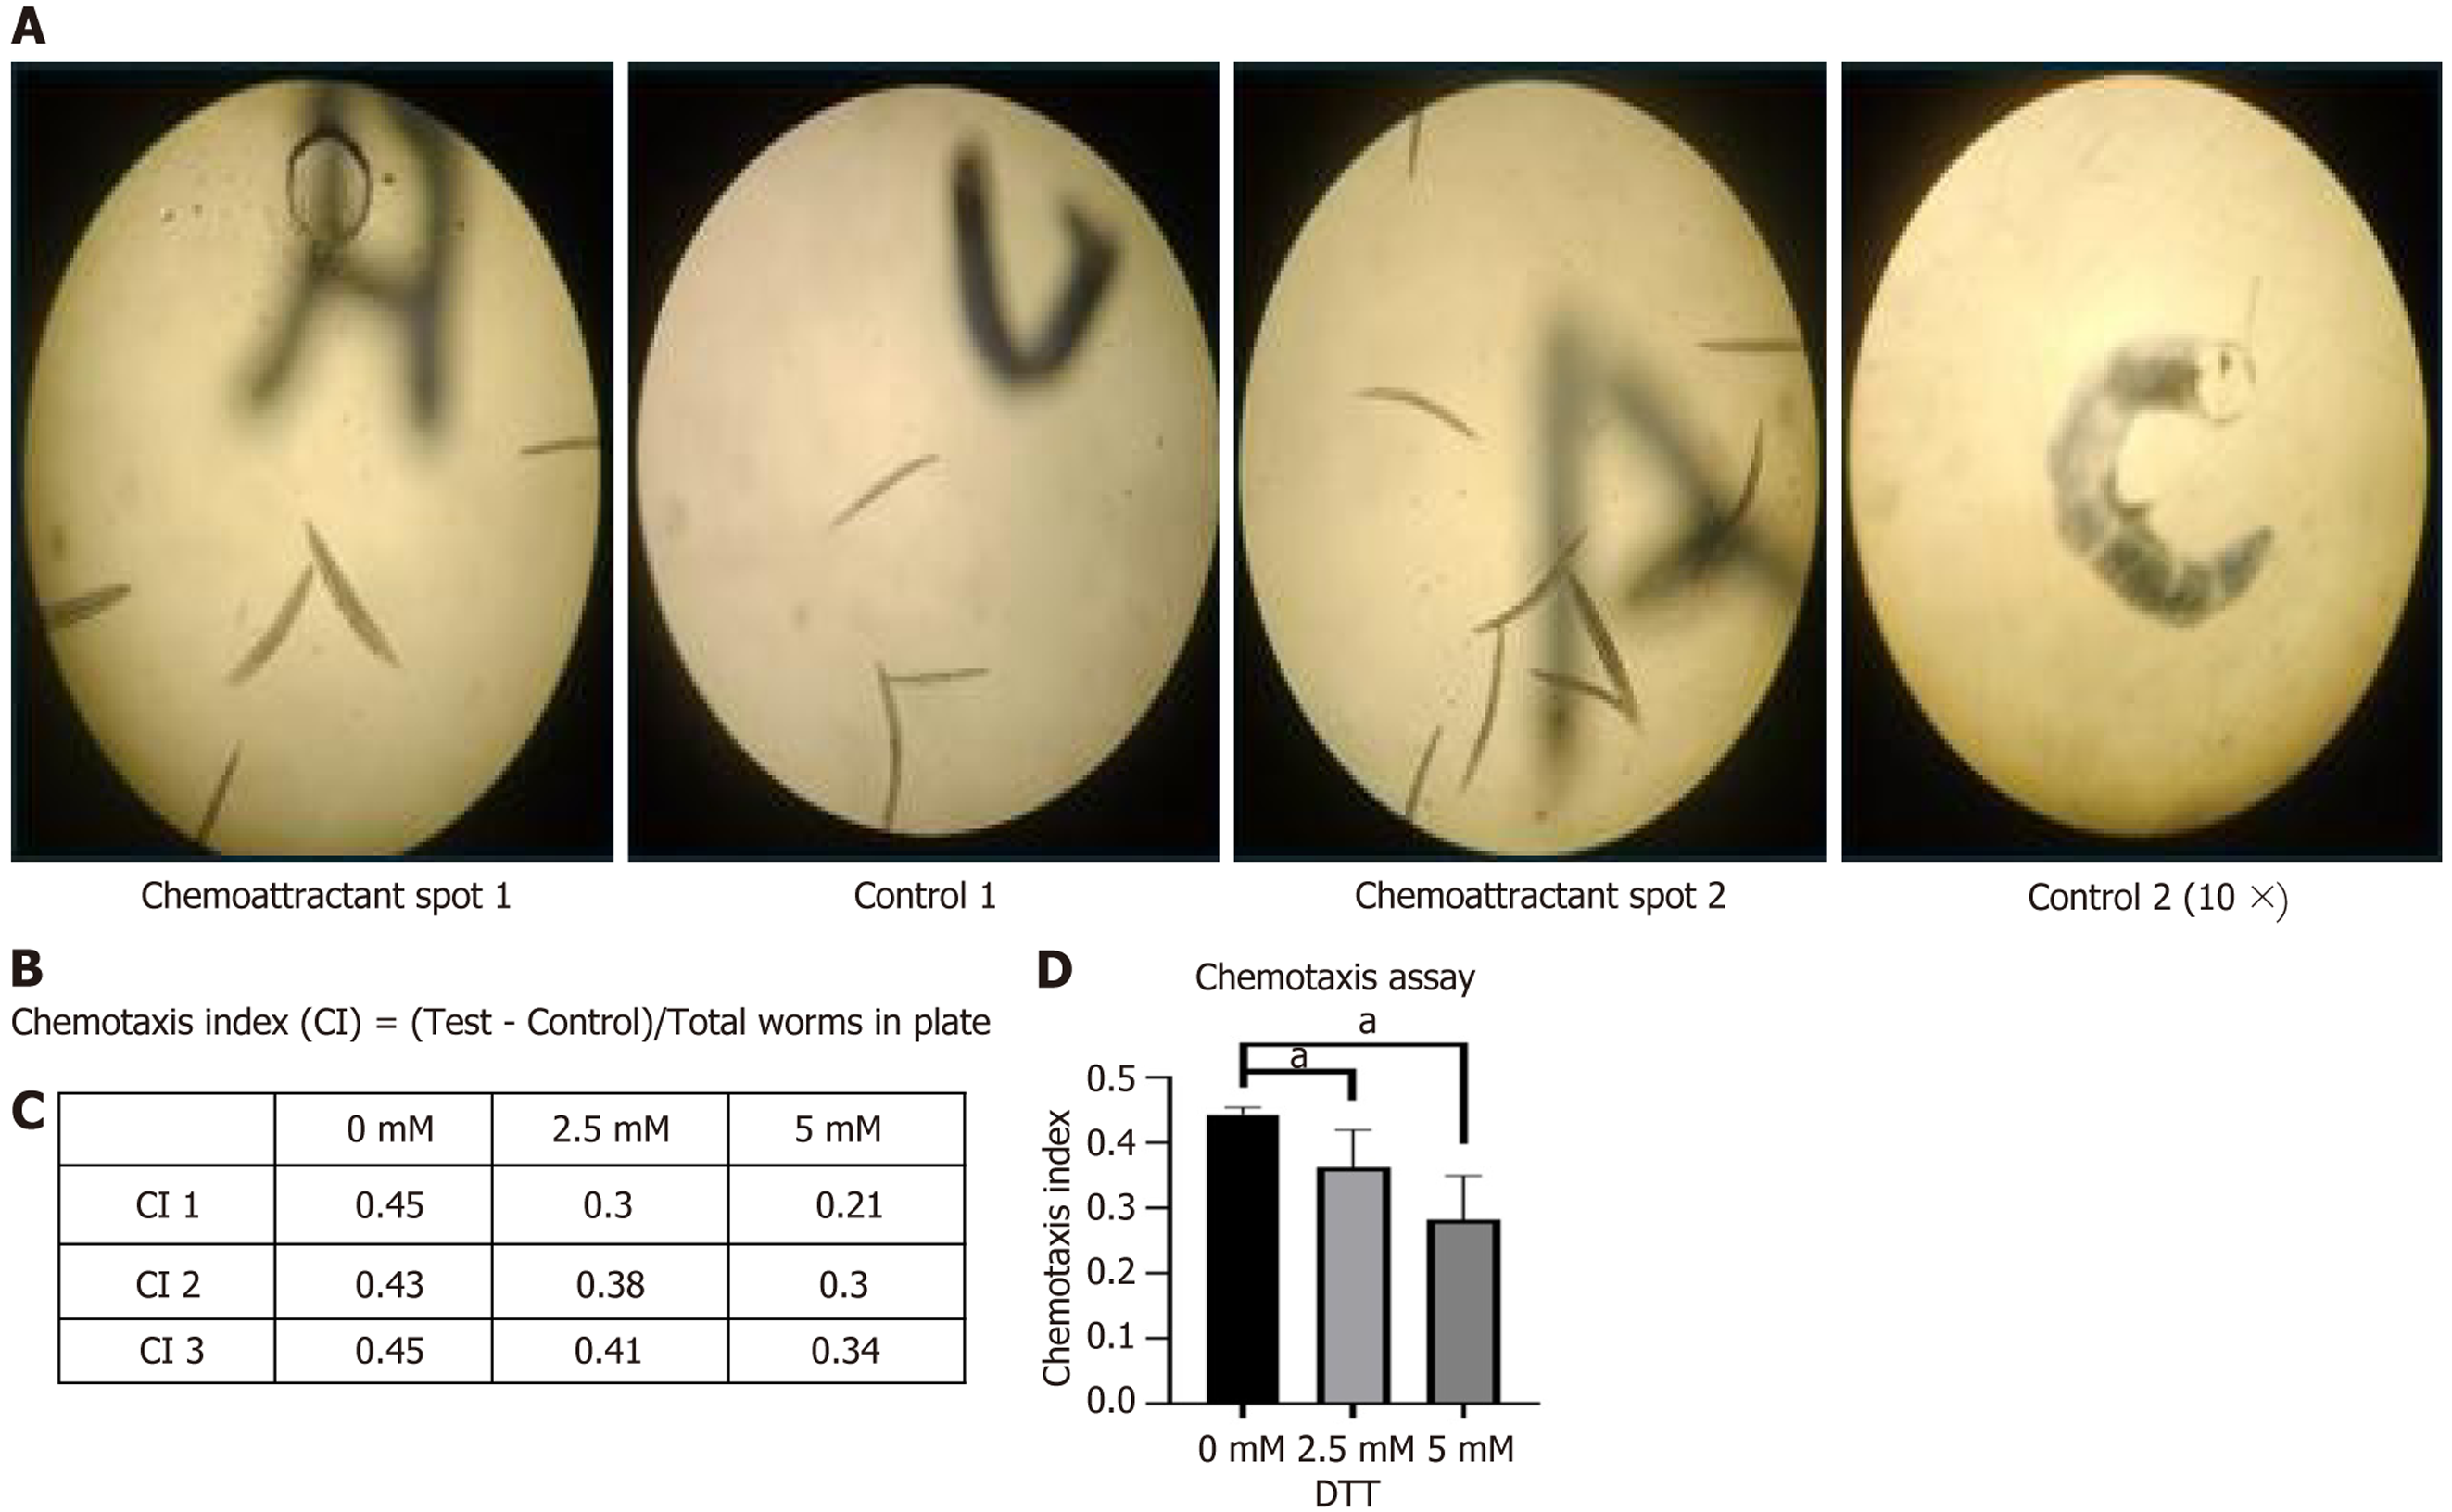
Figure 4 Chemotaxis assay.
A: Collect data by counting the number of worms on the attractant (test) and the number on the control spots (10 × microscopic images); B: The formula for calculating chemotaxis index; C: Triplicate data of chemotaxis index at different concentrations of dithiothreitol (DTT); D: A significant reduction in chemotaxis was observed at five mM DTT as compared to control (0 mmol/L). Data represent mean ± SEM (n = 3). Statistical significance was determined using Brown-Forsythe and Welch one-way analysis of variance, followed by Dunnett's T3 post hoc test and Kruskal-Wallis test; aP < 0.05. DTT: Dithiothreitol.
- Citation: Raj G, Kumar M, Shreya S, Bhardwaj S, Priya R, Mangalhara KC, Jain BP. Dithiothreitol induced endoplasmic reticulum stress and its role in neurodegeneration in Caenorhabditis elegans. World J Biol Chem 2025; 16(4): 111110
- URL: https://www.wjgnet.com/1949-8454/full/v16/i4/111110.htm
- DOI: https://dx.doi.org/10.4331/wjbc.v16.i4.111110