
















©The Author(s) 2025.
World J Biol Chem. Dec 5, 2025; 16(4): 111110
Published online Dec 5, 2025. doi: 10.4331/wjbc.v16.i4.111110
Published online Dec 5, 2025. doi: 10.4331/wjbc.v16.i4.111110
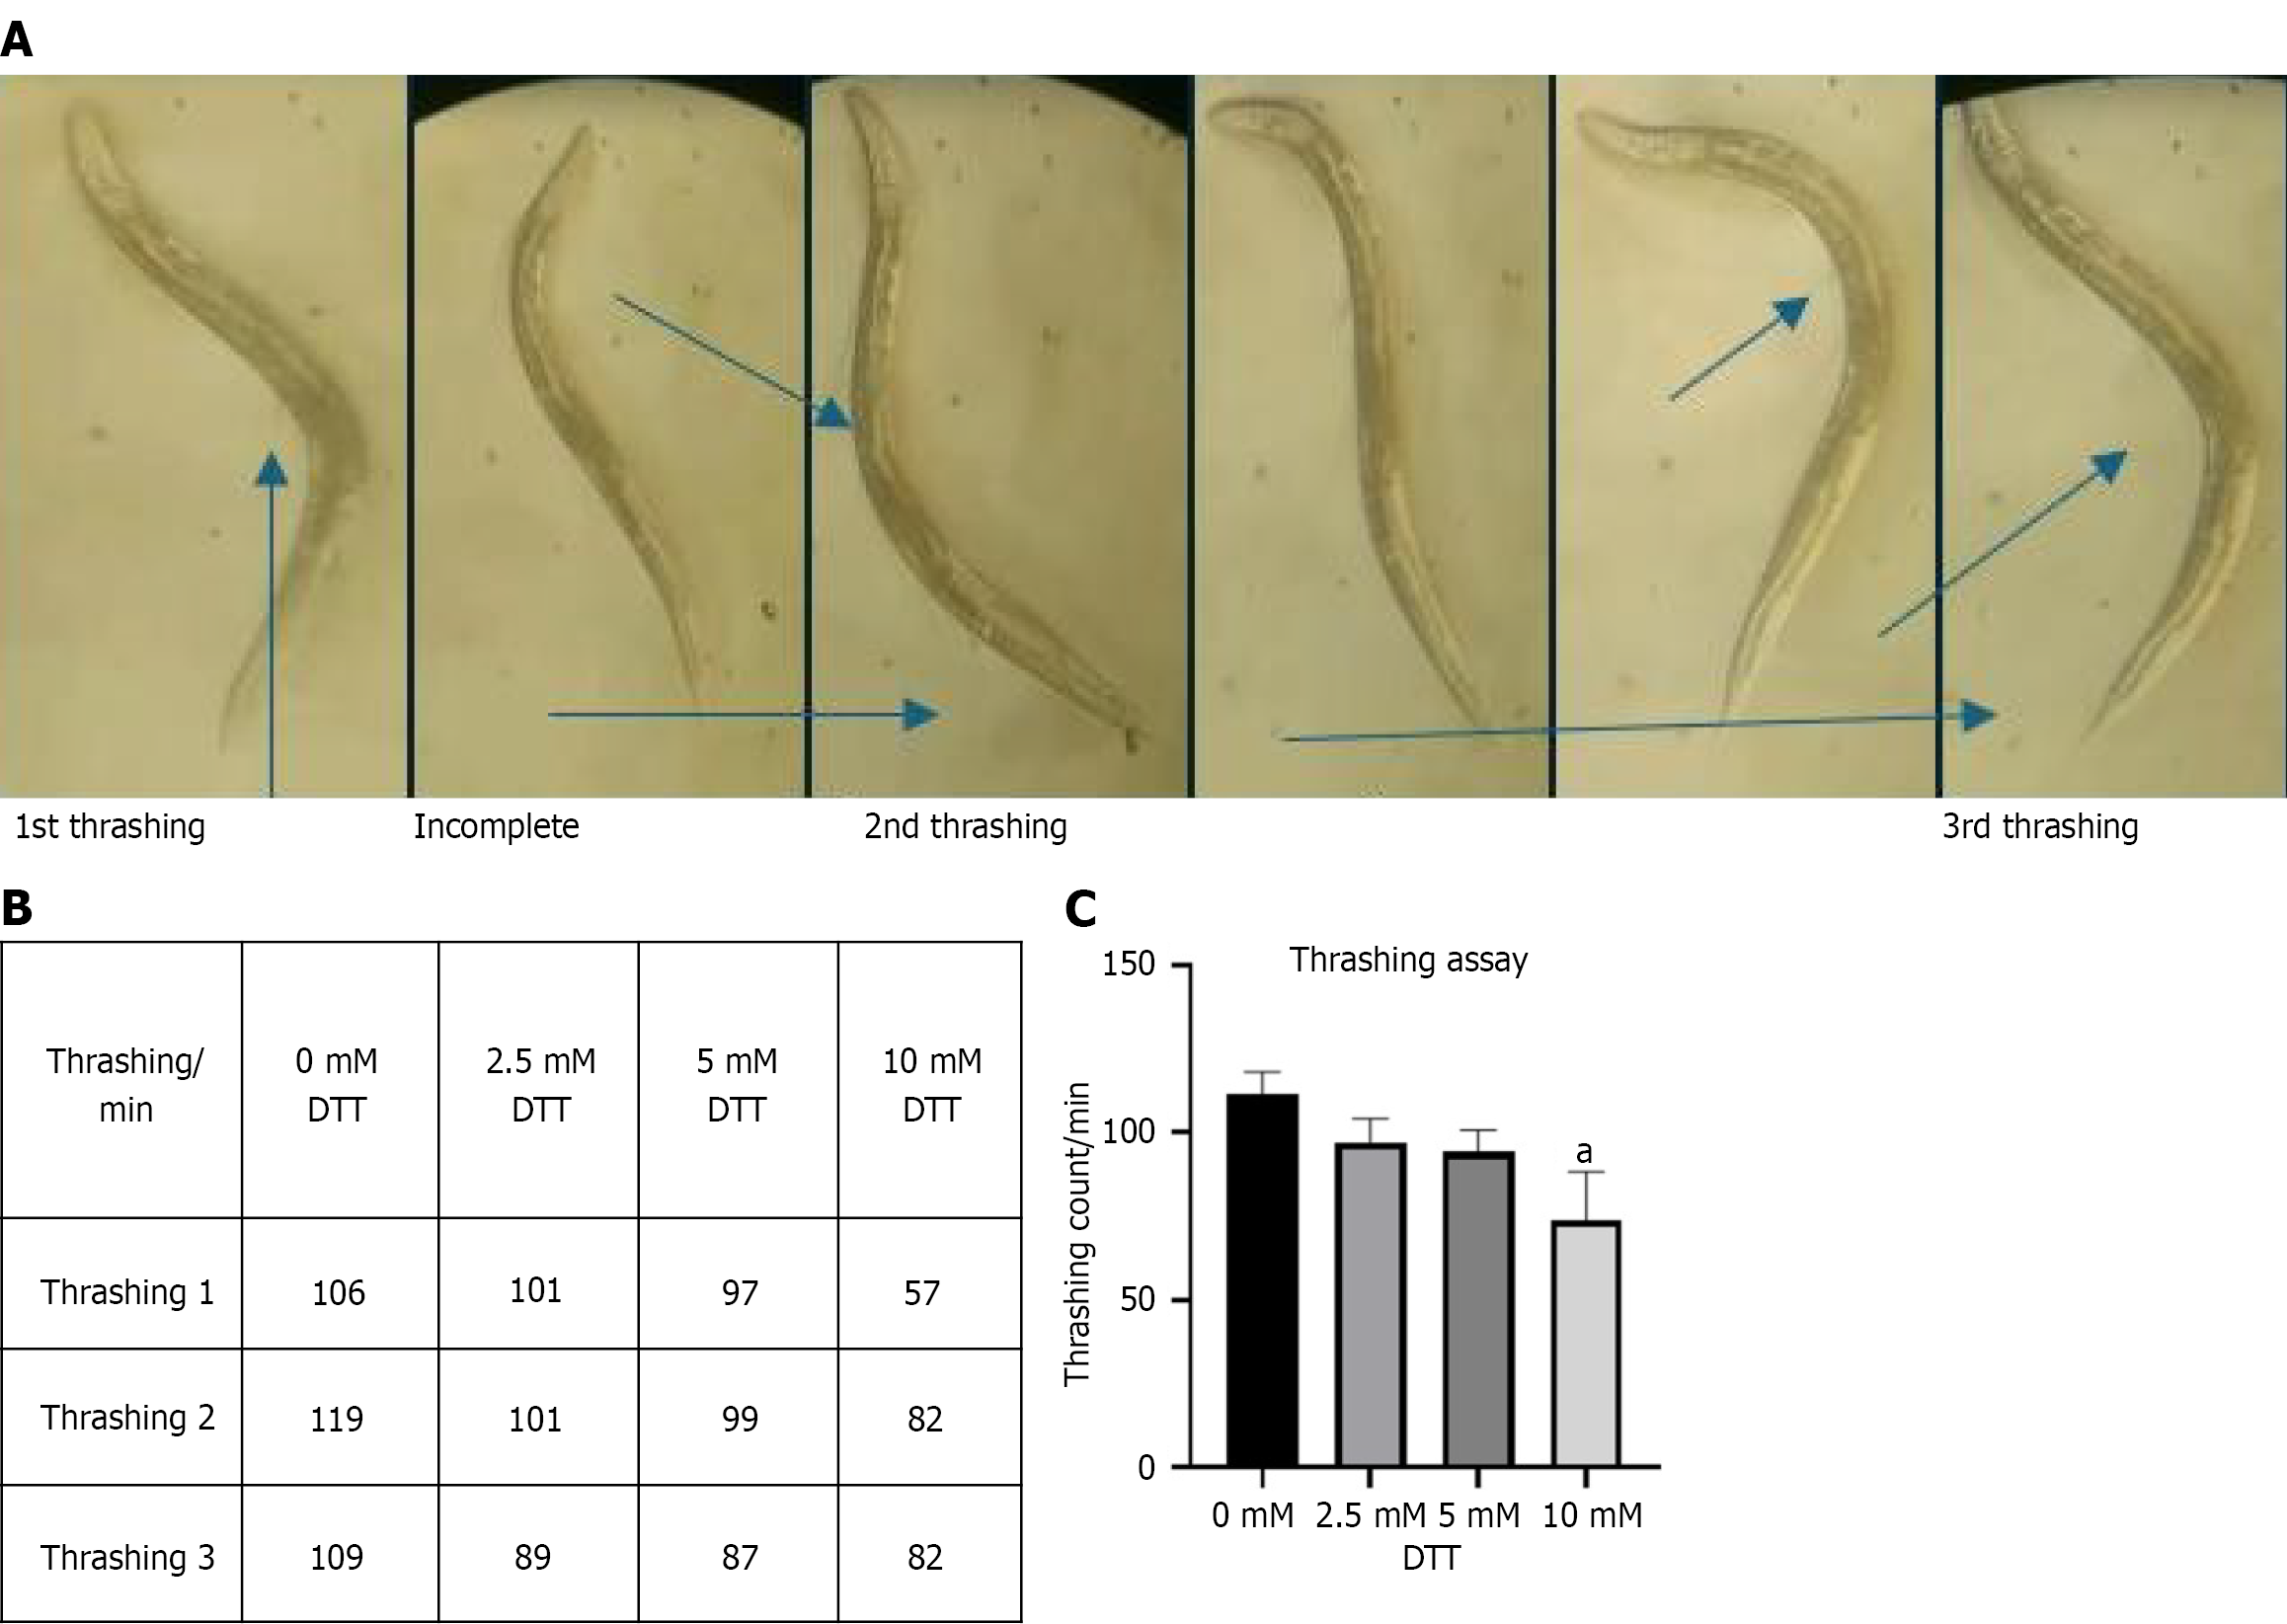
Figure 3 Thrashing assay.
A: Thrashing count analysis starting from the left: The first, 3rd, and last image shows the worm in complete thrashing. The second, 4th, and 5th frame shows an incomplete movement where the worm does not fully bend to the opposite side; B: Average thrashing count per minute at different dithiothreitol (DTT) concentrations (0-10 mmol/L); C: The thrashing graph shows the decline in count where animals were exposed to increasing concentrations of DTT (0–10 mmol/L). Data are presented as mean ± SEM. Statistical analysis was performed using the Kruskal-Wallis test. aP < 0.001 vs control (0 mmol/L DTT). DTT: Dithiothreitol.
- Citation: Raj G, Kumar M, Shreya S, Bhardwaj S, Priya R, Mangalhara KC, Jain BP. Dithiothreitol induced endoplasmic reticulum stress and its role in neurodegeneration in Caenorhabditis elegans. World J Biol Chem 2025; 16(4): 111110
- URL: https://www.wjgnet.com/1949-8454/full/v16/i4/111110.htm
- DOI: https://dx.doi.org/10.4331/wjbc.v16.i4.111110