Copyright
©The Author(s) 2022.
World J Biol Chem. Jan 27, 2022; 13(1): 15-34
Published online Jan 27, 2022. doi: 10.4331/wjbc.v13.i1.15
Published online Jan 27, 2022. doi: 10.4331/wjbc.v13.i1.15
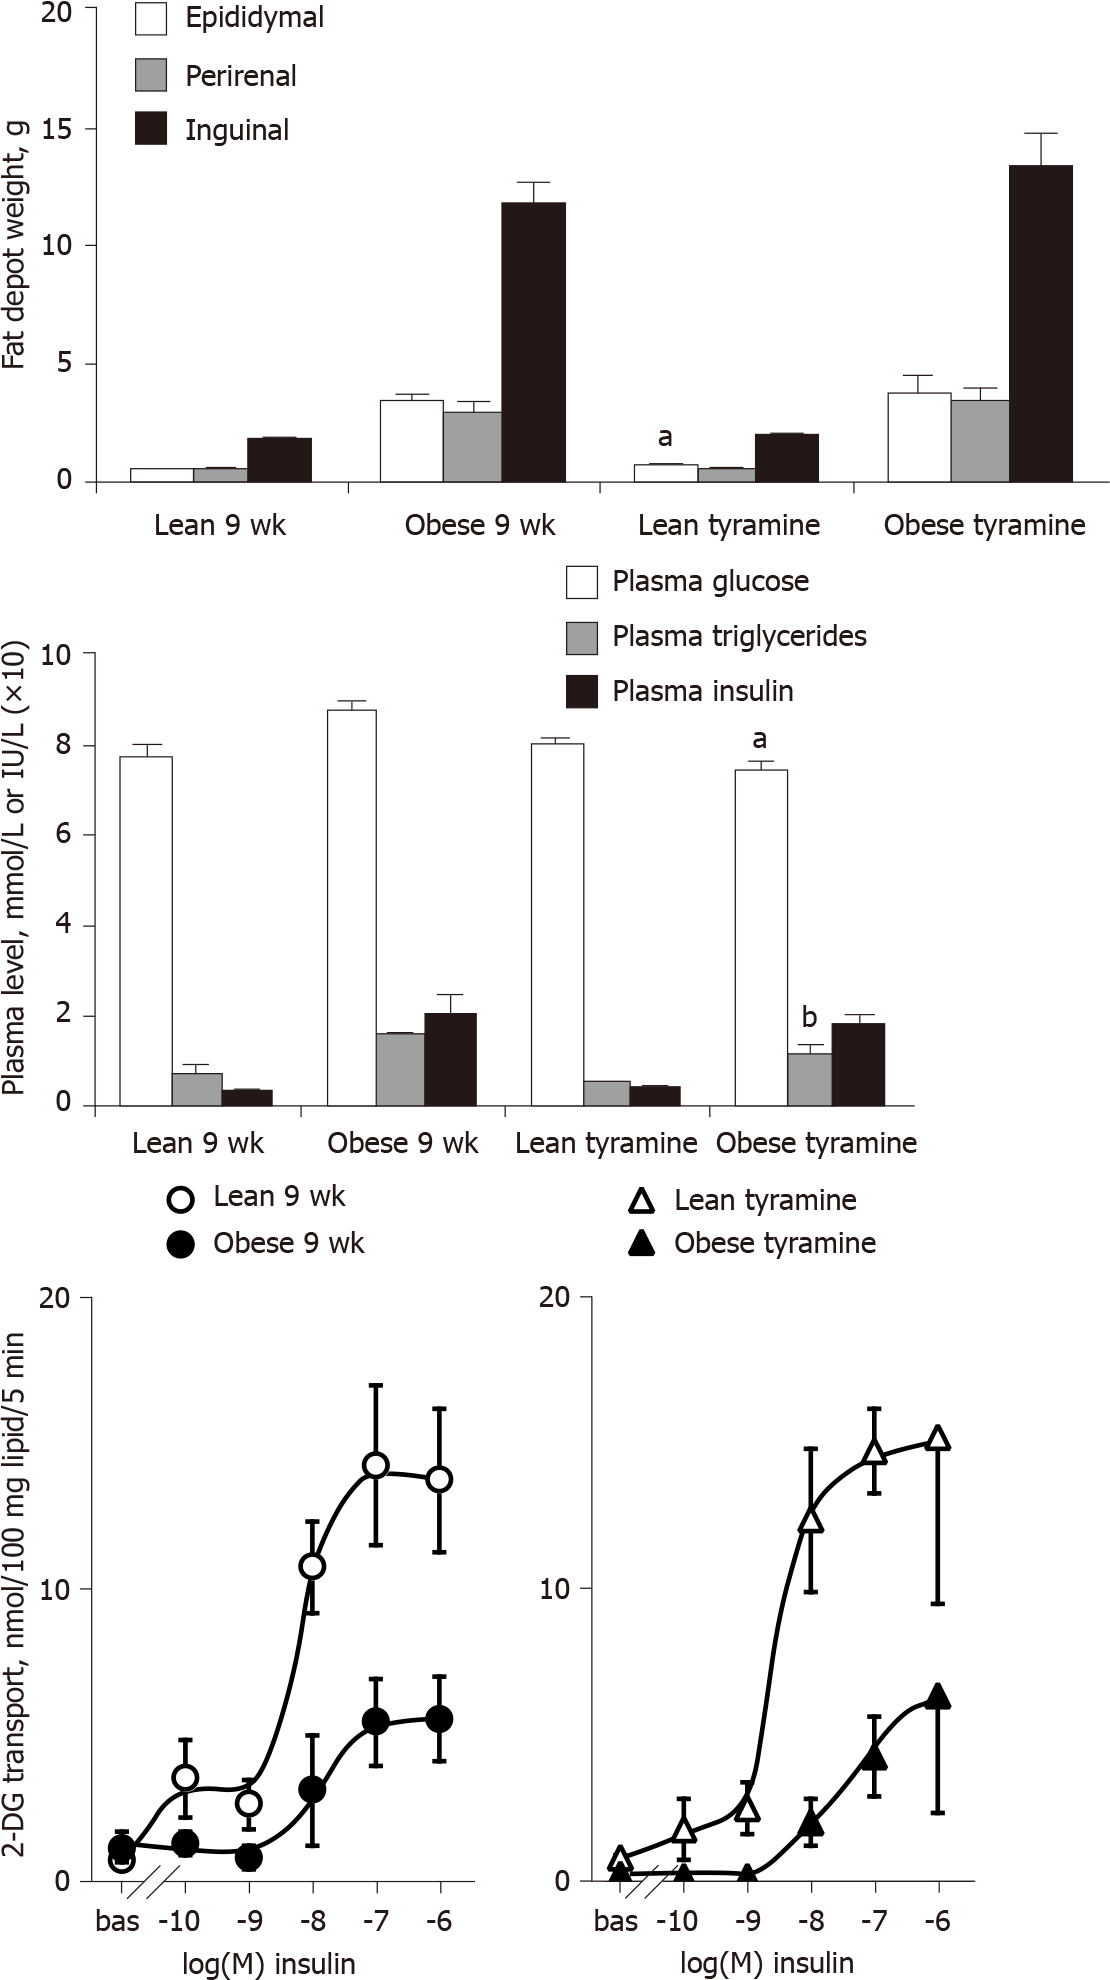
Figure 9 Influence of ‘tyramine + vanadate’ treatment on adiposity, glucose and lipid handling, and insulin responsiveness of adipocytes in lean and obese rats.
Upper part: Weight of three white adipose tissues from 9-wk old Zucker male rats, either from the lean and obese control groups (left) or from the groups receiving daily s.c. administration of 3 mg/kg tyramine + 0.3 mg/kg vanadate (tyramine, right) for 7 d. Middle part: Glucose, triacylglycerol, and insulin fasting plasma levels in the same control and treated groups. Lower part: Hexose transport in adipocytes from lean (open symbols) or obese (closed symbols) rats, in the absence (bas = basal) or presence of the indicated doses of insulin in control (circles) or treated (triangles) groups. Each column or point is the mean ± SEM of three treated or four control rats per genotype. The influence of genotype on all parameters was identical to that specified in previous figures and not indicated for the sake of clarity. Significant difference between tyramine-treated and corresponding control at: aP < 0.05; bP < 0.01.
- Citation: Carpéné C, Marti L, Morin N. Increased monoamine oxidase activity and imidazoline binding sites in insulin-resistant adipocytes from obese Zucker rats . World J Biol Chem 2022; 13(1): 15-34
- URL: https://www.wjgnet.com/1949-8454/full/v13/i1/15.htm
- DOI: https://dx.doi.org/10.4331/wjbc.v13.i1.15


