Copyright
©2010 Baishideng Publishing Group Co.
World J Biol Chem. May 26, 2010; 1(5): 95-102
Published online May 26, 2010. doi: 10.4331/wjbc.v1.i5.95
Published online May 26, 2010. doi: 10.4331/wjbc.v1.i5.95
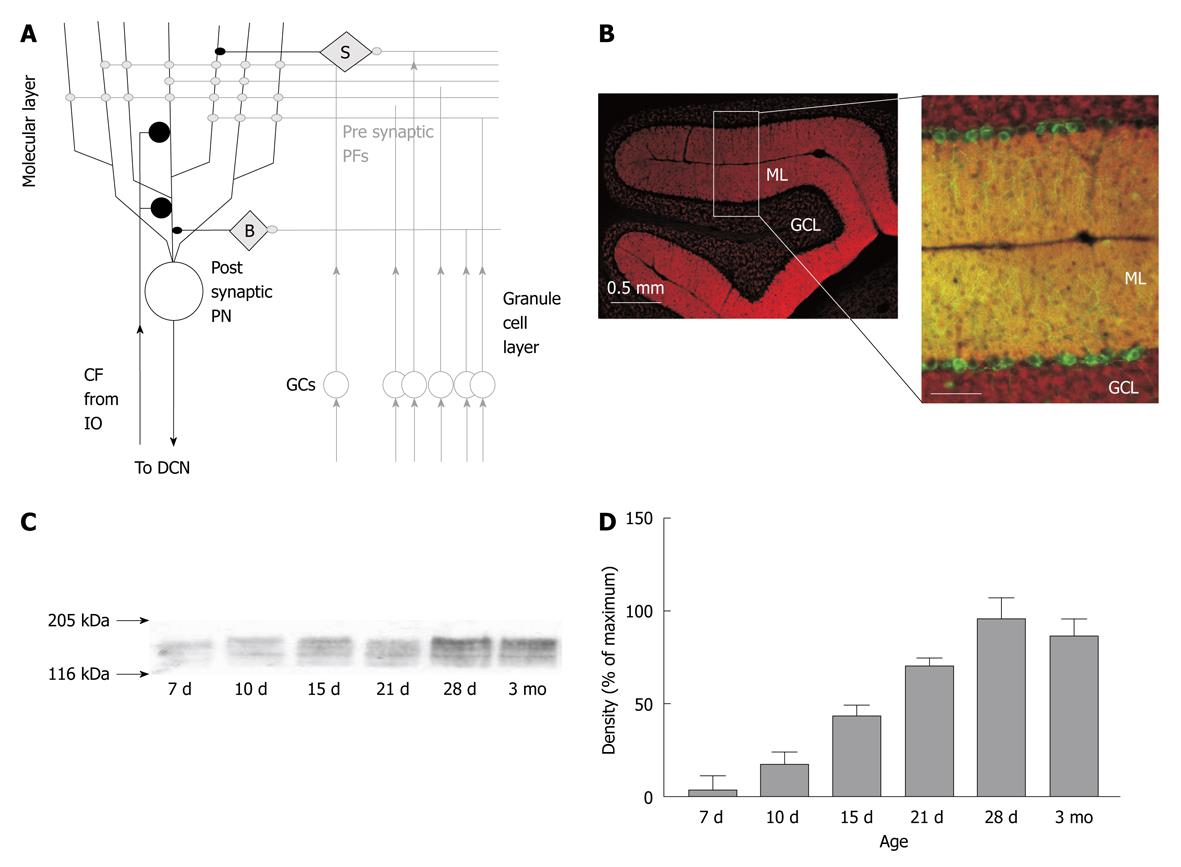
Figure 1 Expression of PMCA2 in the cerebellar cortex.
A: Schematic of cerebellar cortex circuitry and the synapses therein. PN: Purkinje neuron; PF: Parallel fibre; CF: Climbing fibre; GC: Granule cells; IO: Inferior olive; B: Basket cell molecular layer interneuron; S: Stellate cell molecular layer (ML) interneuron; DCN: Deep cerebellar nuclei; B: PMCA2 expression in PNs and GCs from mouse. Left panel is a low magnification image of a sagittal section of the cerebellar cortex, showing rich expression of PMCA2 (red) in the ML and the weaker level of PMCA2 expression in the granule cell layer (GCL). The right panel shows at higher magnification the same pattern of PMCA2 expression in the ML and GCL (red), now with the PNs identified by their expression of parvalbumin, shown in green, and the overlapping expression of PN PV and PMCA2 as yellow, scale bar is 100 microns; C: Increased expression of PMCA2 during increasing post natal days of rat development as detected by western blot (i.e. protein immunoblot) from cerebellar tissue. Arrows represent the approximate position of the molecular weight markers; D: A quantitative estimate of PMCA2 expression from Western blots from cerebellar tissue from up to 4 animals at each time point; values are normalized to maximal expression of PMCA2 in the cerebellum and bars represent mean and error bars ± SE.
- Citation: Huang H, Nagaraja RY, Garside ML, Akemann W, Knöpfel T, Empson RM. Contribution of plasma membrane Ca2+ ATPase to cerebellar synapse function. World J Biol Chem 2010; 1(5): 95-102
- URL: https://www.wjgnet.com/1949-8454/full/v1/i5/95.htm
- DOI: https://dx.doi.org/10.4331/wjbc.v1.i5.95


