Copyright
©2012 Baishideng Publishing Group Co.
World J Biol Chem. Feb 26, 2012; 3(2): 34-40
Published online Feb 26, 2012. doi: 10.4331/wjbc.v3.i2.34
Published online Feb 26, 2012. doi: 10.4331/wjbc.v3.i2.34
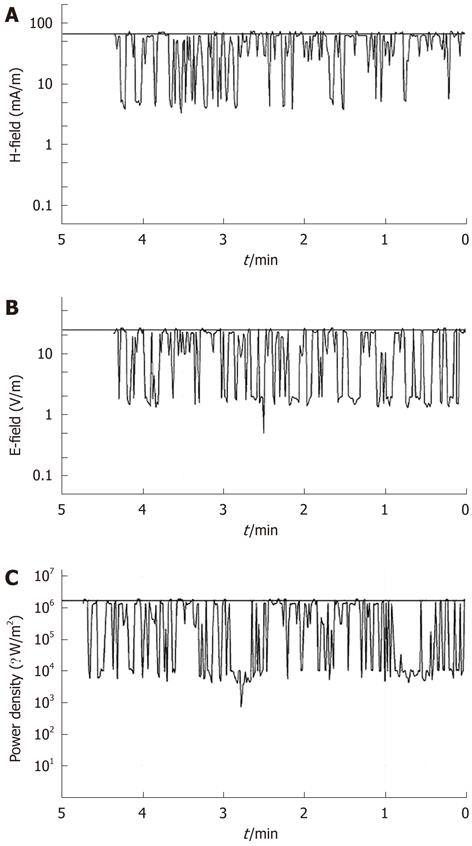
Figure 1 A time analysis of the electromagnetic field measured by a Narda SRM-3000 around 1760 MHz during exposure at 3 cm from the antenna of a mobile phone with specific absorption rate = 0.
086 W/Kg. Cell cultures were placed at 3 cm from the antenna of the mobile phone. A: Time analysis of the H field component around 1760 MHz during exposure, whose intensity remained < 66 mA/m; B: Time analysis of the E field component at the frequency of 1760 MHz, provided during exposure. Its intensity did not exceed 25 V/m; C: Time analysis of the power density of the electromagnetic field impinging upon the cellular cultures. Its intensity remained well below 1.7 W/m2 during exposure.
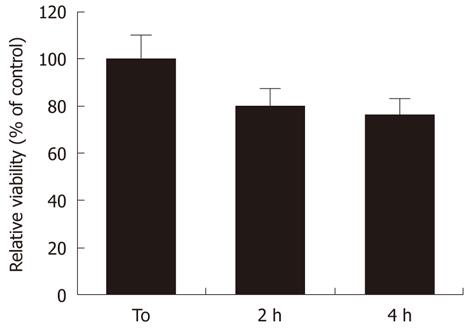
Figure 2 Effect of radiofrequency and microwave radiation on cell viability.
Retinoic acid-differentiated SH-SY5Y neuroblastoma cells were exposed to RF radiation. Two exposures of 2 h and 4 h were carried out. After electromagnetic field treatment, SH-SY5Y cells were incubated for 4 h with fresh medium containing MTT (0.5 mg/mL) at 37.5 °C. The relative absorbance at 540 nm was determined. Data are the mean ± SE from four separate experiments.
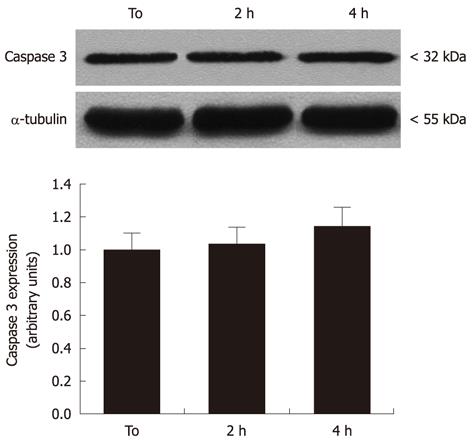
Figure 3 Effects of radiofrequency and microwave radiation exposure on caspase 3 expression in SH-SY5Y neuroblastoma cells.
Retinoic acid-differentiated SH-SY5Y were exposed to radiofrequency and microwave for the selected times. Cellular proteins were extracted for the determination of the expression of caspase 3 (B) by Western blotting. Densitometric analysis of immunoblots (bottom) was also carried out after normalization against α-tubulin. Results were similar in four separate experiments.
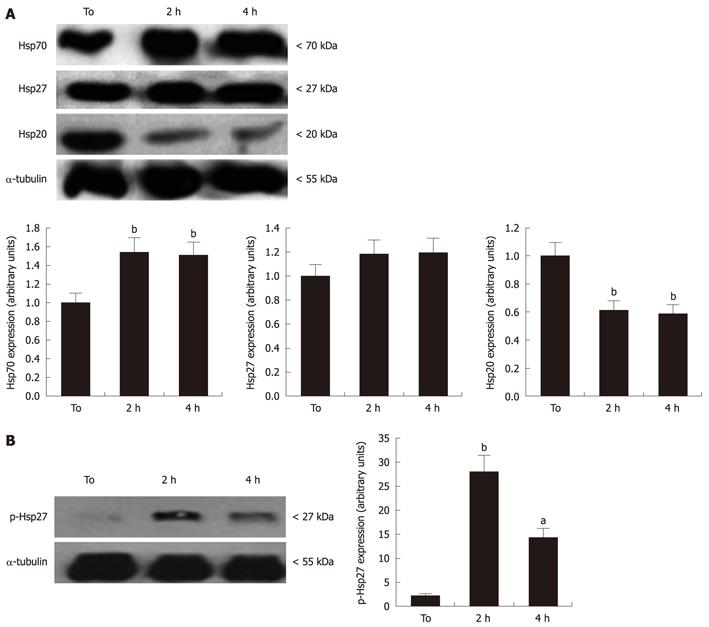
Figure 4 Effects of radiofrequency and microwave radiation exposure on stress proteins in SH-SY5Y neuroblastoma cells.
Retinoic acid-differentiated SH-SY5Y cells were exposed to radiofrequency and microwave for the selected times. Cellular proteins were extracted to determine expression of different heat shock proteins (Hsp) (A) and p-Hsp27 (B) by Western blotting. Densitometric analysis of immunoblots (bottom) was also carried out after normalization against α-tubulin. Results were similar in four separate experiments. aP < 0.05, bP < 0.01 vs sham-treated cells.
- Citation: Calabrò E, Condello S, Currò M, Ferlazzo N, Caccamo D, Magazù S, Ientile R. Modulation of heat shock protein response in SH-SY5Y by mobile phone microwaves. World J Biol Chem 2012; 3(2): 34-40
- URL: https://www.wjgnet.com/1949-8454/full/v3/i2/34.htm
- DOI: https://dx.doi.org/10.4331/wjbc.v3.i2.34


