
















Copyright: ©Author(s) 2026.
World J Gastrointest Surg. Sep 27, 2026; 18(9): 122446
Published online Sep 27, 2026. doi: 10.4240/wjgs.122446
Published online Sep 27, 2026. doi: 10.4240/wjgs.122446
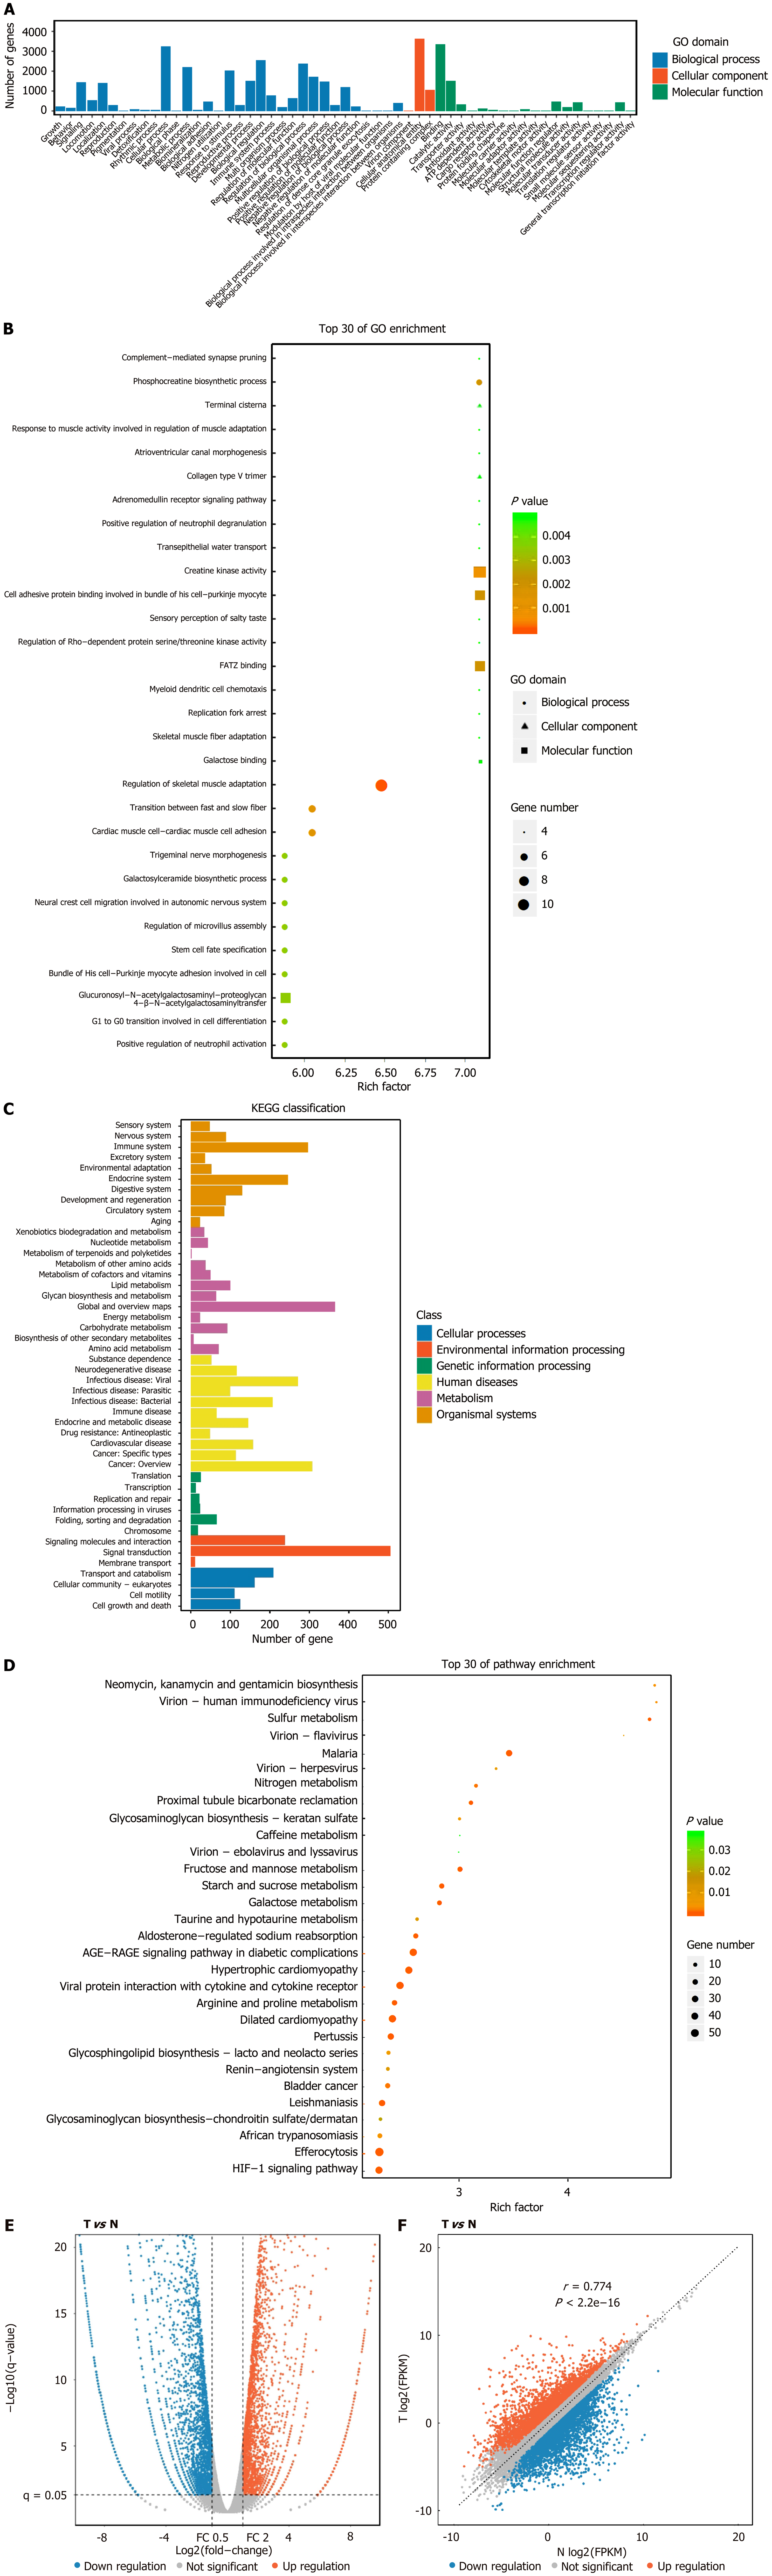
Figure 3 Gene Ontology and Kyoto Encyclopedia of Genes and Genomes analysis with volcano and scatter plots of differentially expressed mRNAs between cancer and adjacent tissues.
A: Gene Ontology (GO) classification; B: GO enrichment. X-axis label represents rich factor, Y-axis label represents GO term. Size, shape and color of the bubble represent amount of differentially expressed (DE) mRNAs, classification and enrichment significance, respectively; C: Kyoto Encyclopedia of Genes and Genomes (KEGG) classification; D: KEGG enrichment. X-axis label represents rich factor, Y-axis label represents pathway. Size, and color of the bubble represent amount of DE mRNAs and enrichment significance, respectively; E: Up-regulated and down-regulated mRNAs were showed by the volcano plot; F: The differential expression of mRNAs between cancerous and adjacent normal tissues was evaluated using a scatter plot. Red points indicate up-regulated mRNAs, and blue points indicate down-regulated mRNAs. GO: Gene Ontology; KEGG: Kyoto Encyclopedia of Genes and Genomes; DE: Differentially expressed; T: Tumor; N: Adjacent normal tissue.
- Citation: Lv K, Dong LZ, Yang H, Liu YL, Li H, Jia KL, Zhao XH, Chen JB. Perianal Paget’s disease with concomitant rectal cancer: A case report. World J Gastrointest Surg 2026; 18(9): 122446
- URL: https://www.wjgnet.com/1948-9366/full/v18/i9/122446.htm
- DOI: https://dx.doi.org/10.4240/wjgs.122446