
















Copyright: ©Author(s) 2026.
World J Gastrointest Surg. Sep 27, 2026; 18(9): 120780
Published online Sep 27, 2026. doi: 10.4240/wjgs.120780
Published online Sep 27, 2026. doi: 10.4240/wjgs.120780
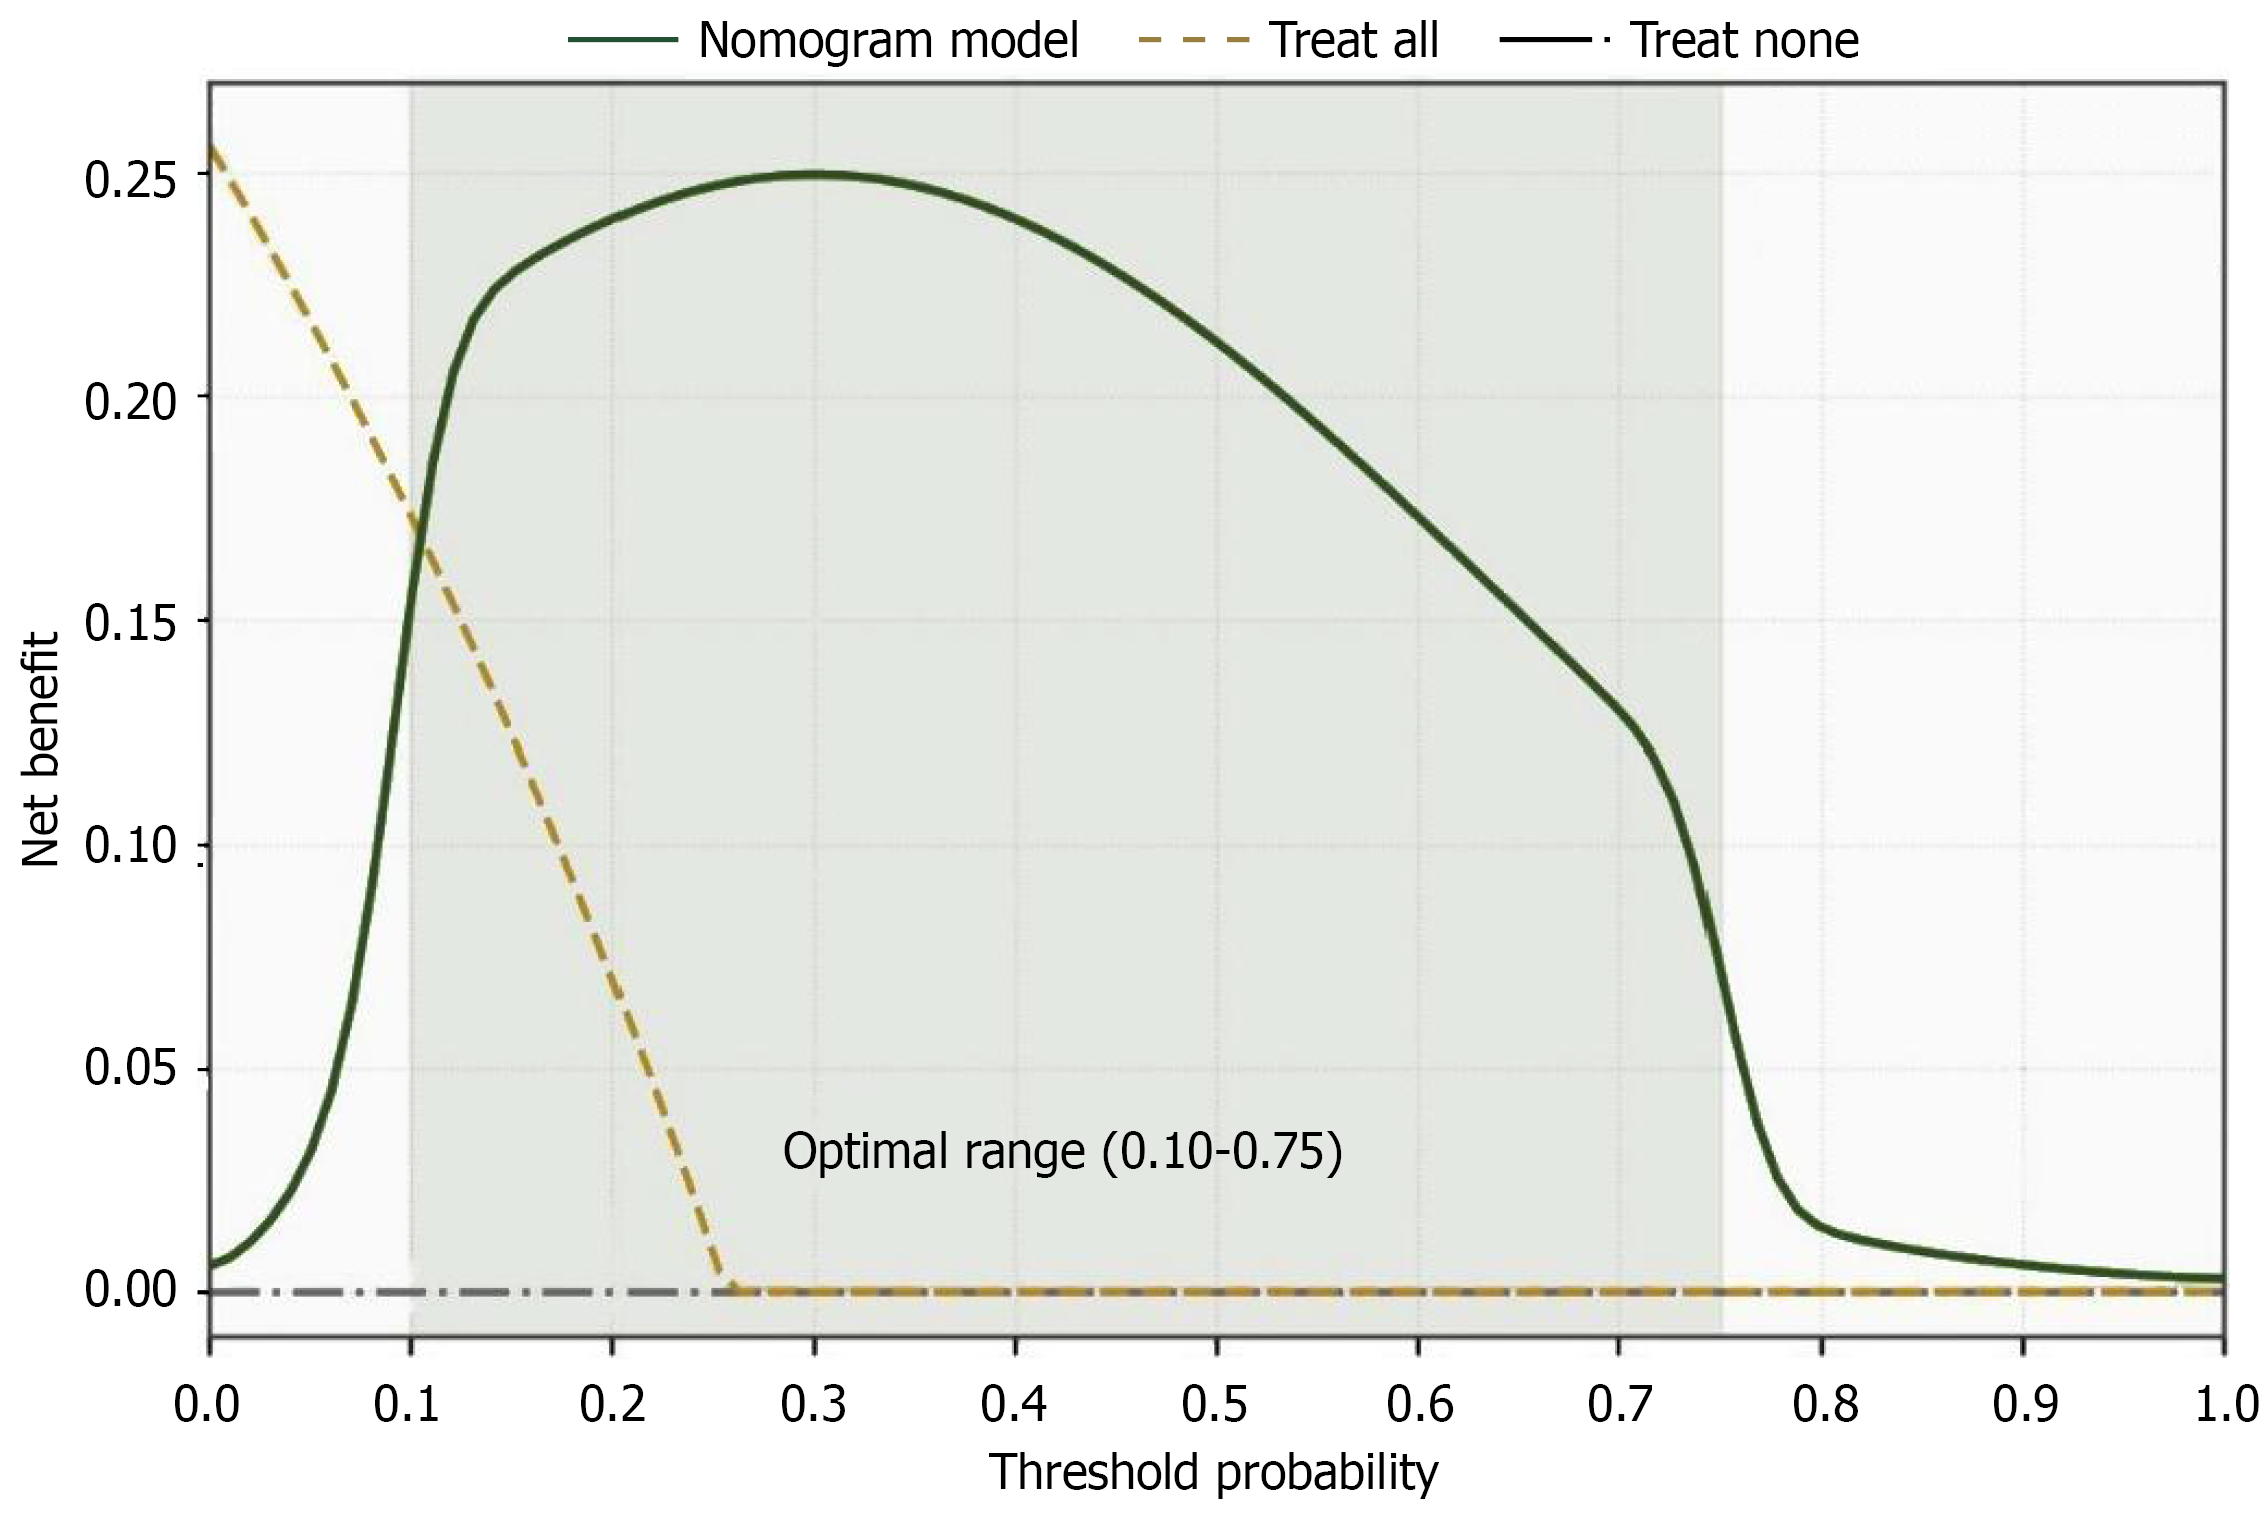
Figure 4 Decision curve analysis of the nomogram prediction model.
The decision curve analysis evaluates the clinical net benefit of the nomogram across a range of threshold probabilities. The solid line represents the nomogram model, the dashed line represents the “Treat All” strategy, and the dash-dotted horizontal line represents the “Treat None” strategy. The nomogram demonstrated superior net benefit over both extreme strategies across a threshold probability range of 0.10 to 0.75 (shaded area), indicating favorable clinical utility and supporting its application in guiding individualized perioperative decision-making.
- Citation: Wang CY, He HY, Li SS, Zhu QQ. Risk factors and nomogram for predicting delayed gastrointestinal recovery after radical gastrectomy. World J Gastrointest Surg 2026; 18(9): 120780
- URL: https://www.wjgnet.com/1948-9366/full/v18/i9/120780.htm
- DOI: https://dx.doi.org/10.4240/wjgs.120780