















Copyright: ©Author(s) 2026.
World J Gastrointest Surg. Sep 27, 2026; 18(9): 120780
Published online Sep 27, 2026. doi: 10.4240/wjgs.120780
Published online Sep 27, 2026. doi: 10.4240/wjgs.120780
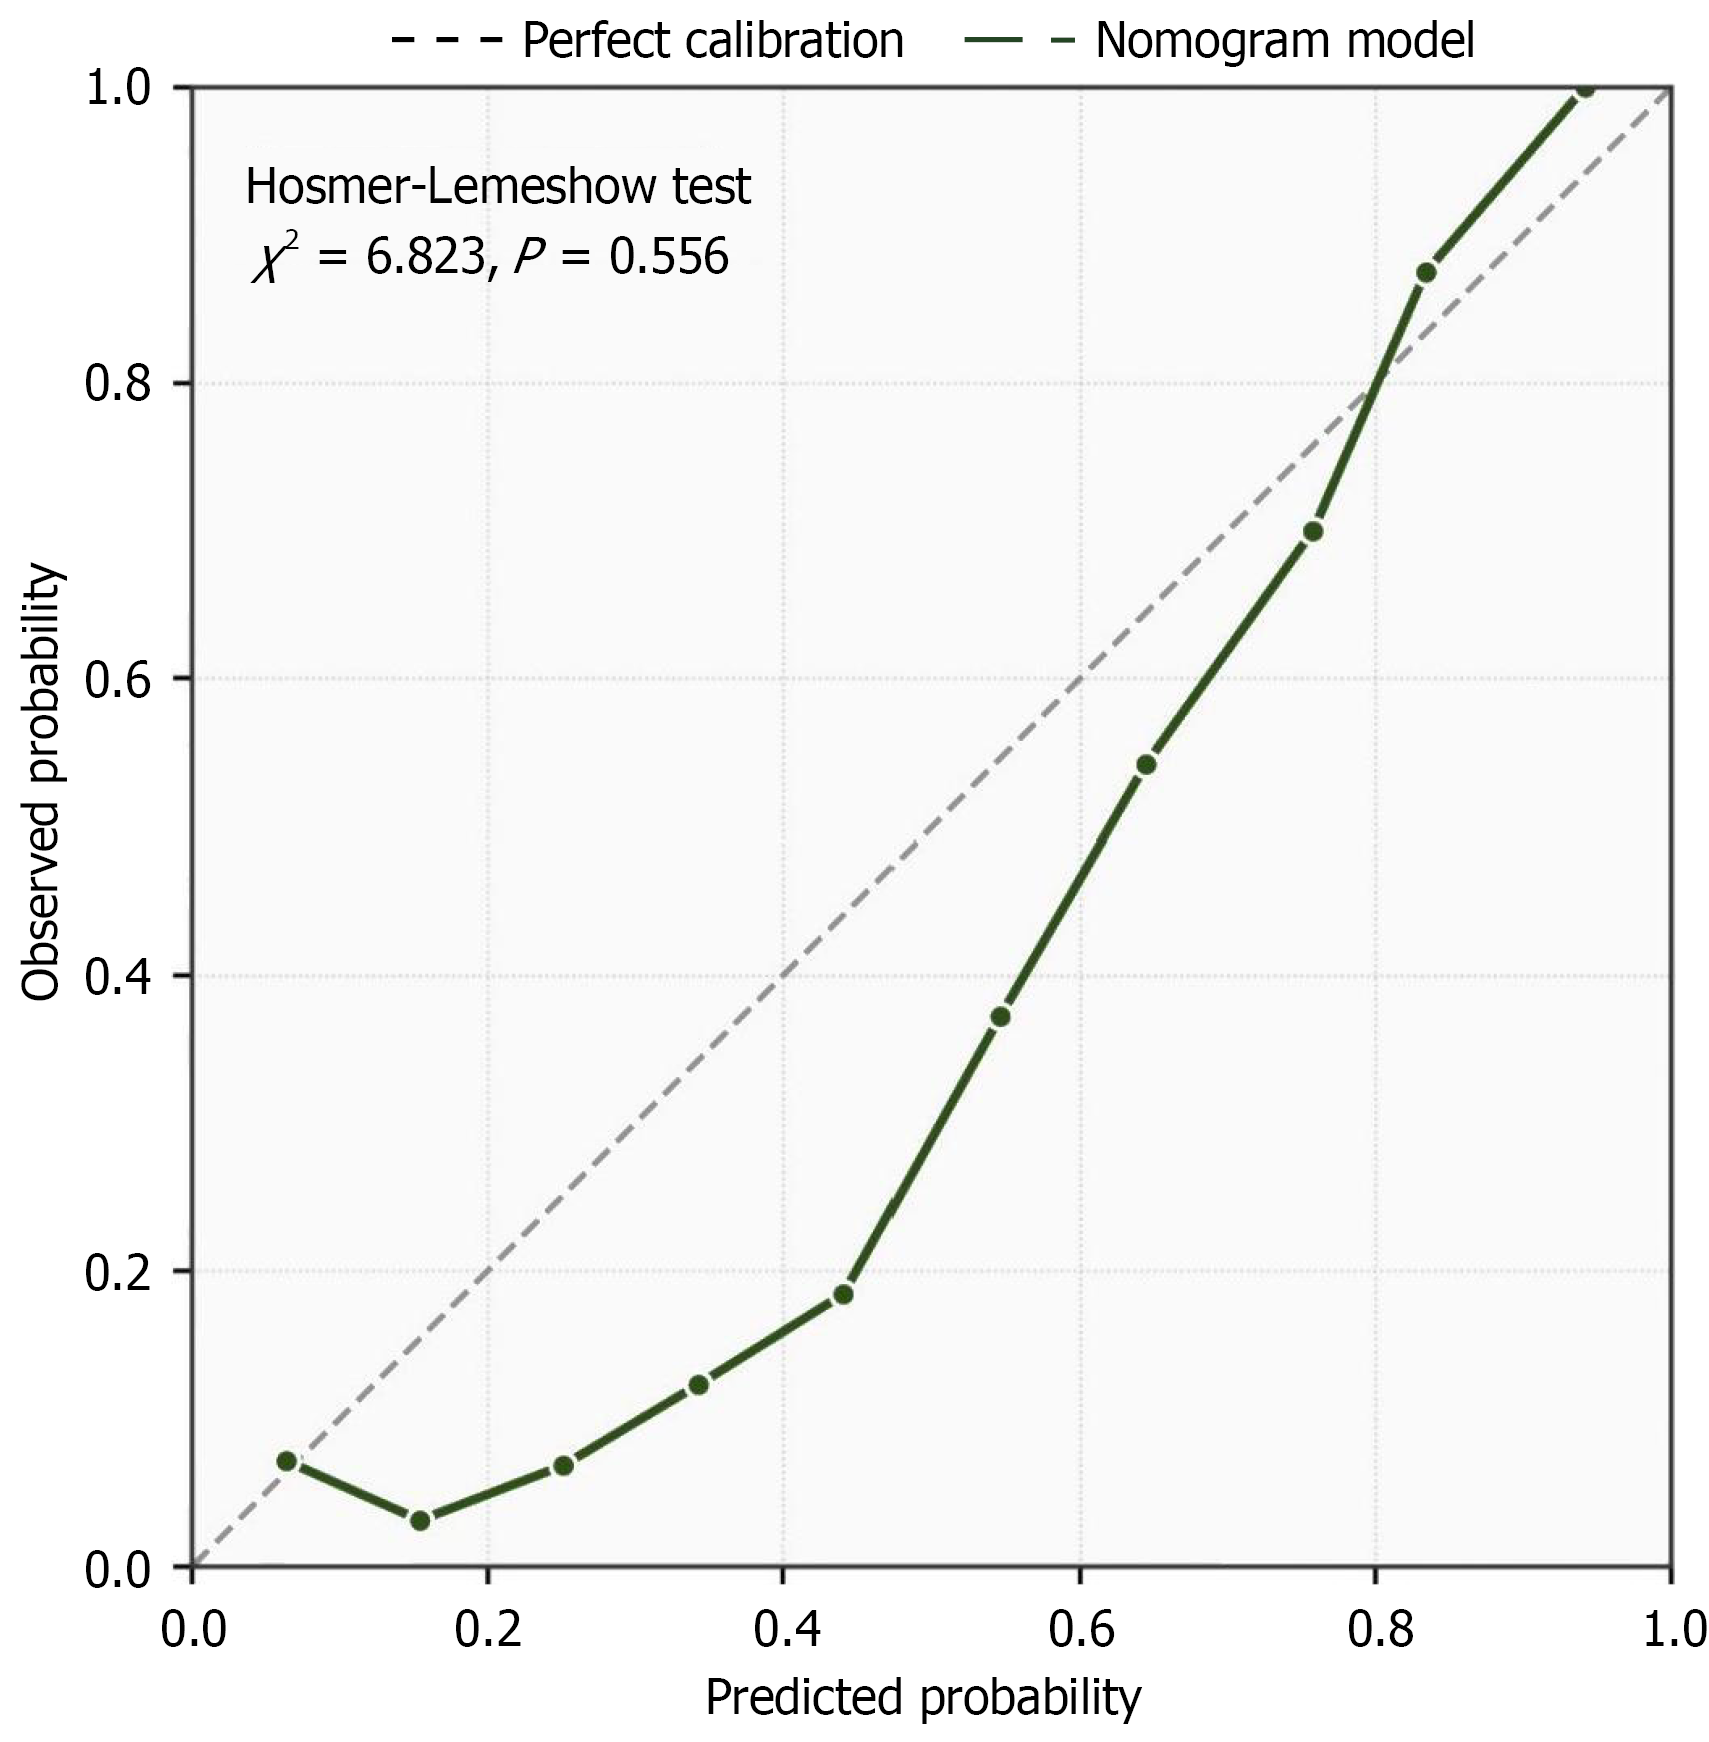
Figure 3 Calibration curve of the nomogram prediction model.
The calibration curve illustrates the agreement between predicted probabilities and observed outcomes of delayed gastrointestinal recovery after radical gastrectomy. The dashed diagonal line represents perfect calibration, while the solid line with dots represents the nomogram model. The Hosmer-Lemeshow test yielded χ2 = 6.823 (P = 0.556), indicating no significant deviation from perfect calibration and confirming satisfactory goodness-of-fit of the model.
- Citation: Wang CY, He HY, Li SS, Zhu QQ. Risk factors and nomogram for predicting delayed gastrointestinal recovery after radical gastrectomy. World J Gastrointest Surg 2026; 18(9): 120780
- URL: https://www.wjgnet.com/1948-9366/full/v18/i9/120780.htm
- DOI: https://dx.doi.org/10.4240/wjgs.120780