
















Copyright: ©Author(s) 2026.
World J Gastrointest Surg. Sep 27, 2026; 18(9): 120399
Published online Sep 27, 2026. doi: 10.4240/wjgs.120399
Published online Sep 27, 2026. doi: 10.4240/wjgs.120399
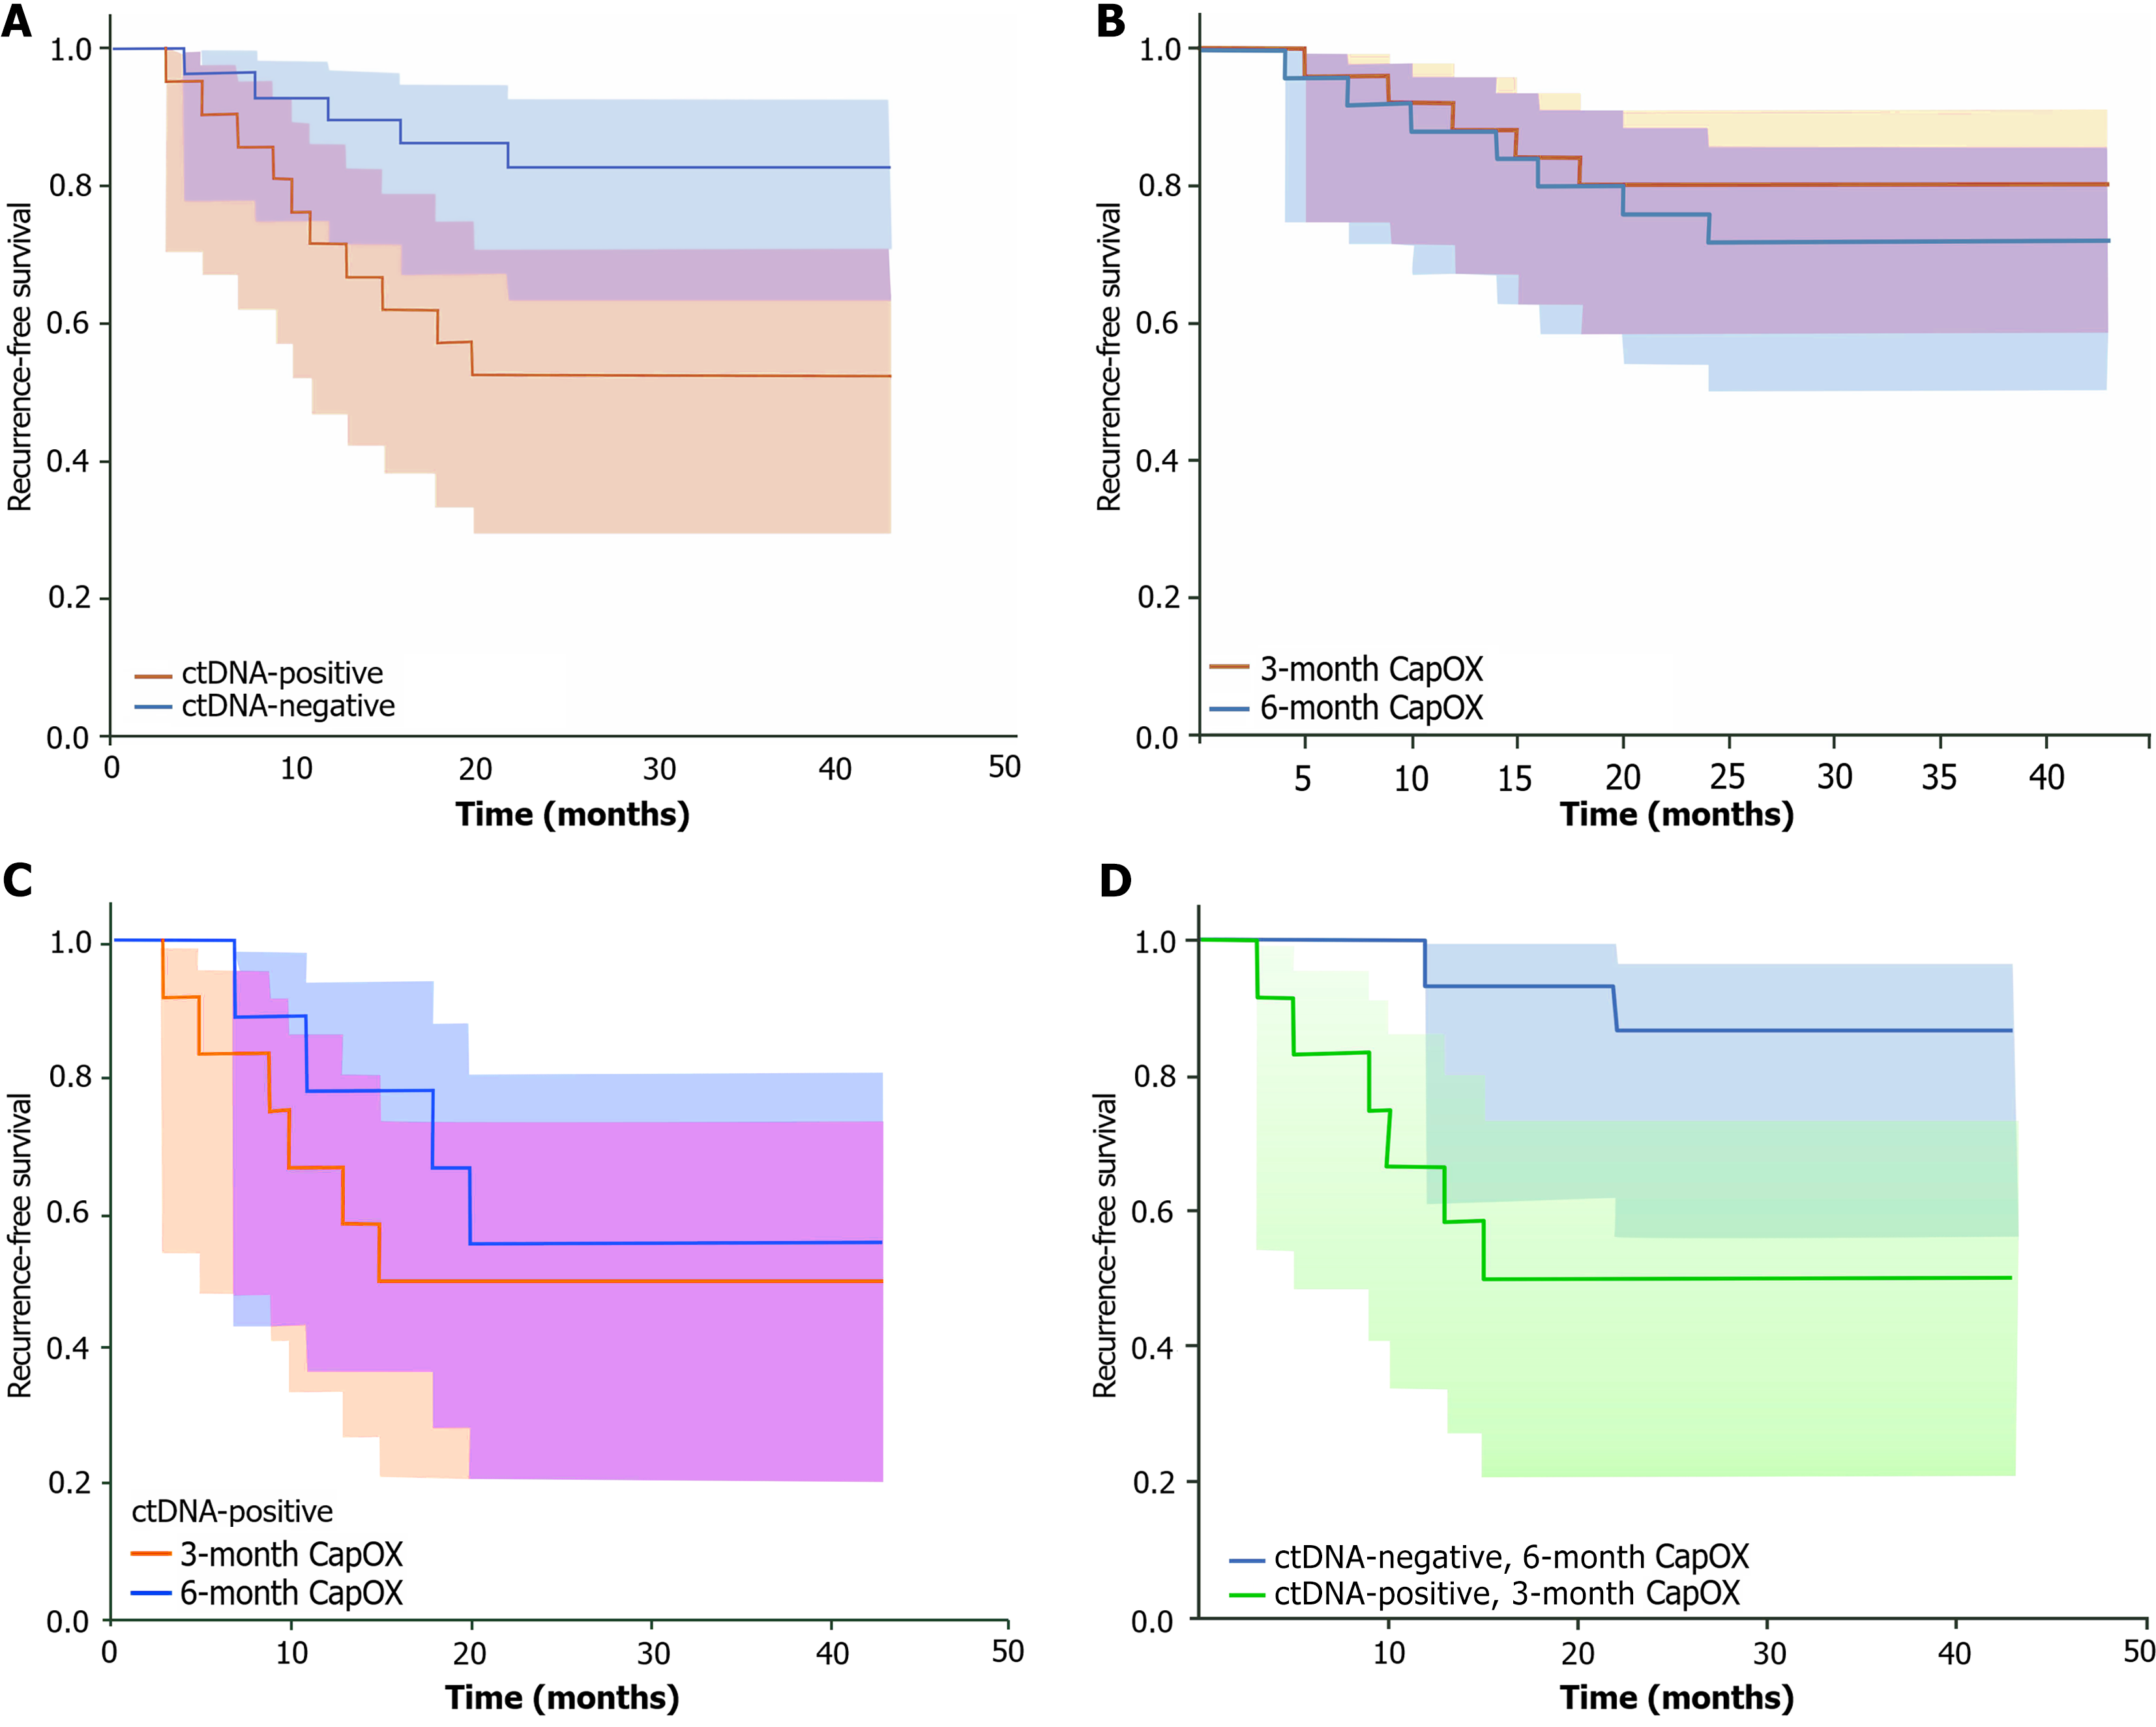
Figure 2 Kaplan-Meier analysis of recurrence-free survival according to postoperative circulating tumor DNA status and adjuvant chemotherapy duration.
A: Kaplan-Meier curves for recurrence-free survival (RFS) stratified by postoperative circulating tumor DNA (ctDNA) status. The curves represent ctDNA-positive and ctDNA-negative patients (Log-rank P = 0.026); B: Kaplan-Meier curves for RFS in ctDNA-positive patients stratified by chemotherapy duration. The curves represent the 3-month and 6-month capecitabine plus oxaliplatin (CapOX) chemotherapy subgroups (Log-rank P = 0.689); C: Kaplan-Meier curves for RFS in ctDNA-negative patients stratified by chemotherapy duration. The legend represents the 3-month and 6-month CapOX chemotherapy subgroups (Log-rank P = 0.512); D: Kaplan-Meier curves for RFS comparing ctDNA-positive patients receiving 3 months of CapOX chemotherapy and ctDNA-negative patients receiving 6 months of CapOX chemotherapy (Log-rank P = 0.038). ctDNA: Circulating tumor DNA; CapoX: Capecitabine plus oxaliplatin.
- Citation: Guo XX, Deng JZ, Cheng LQ, Lin YB, Cao T, Feng JL, Gao YN, Yang XS, Liang SS. Postoperative circulating tumor DNA detection predicts recurrence and guides adjuvant chemotherapy duration in high-risk stage III colorectal cancer. World J Gastrointest Surg 2026; 18(9): 120399
- URL: https://www.wjgnet.com/1948-9366/full/v18/i9/120399.htm
- DOI: https://dx.doi.org/10.4240/wjgs.120399