
















Copyright: ©Author(s) 2026.
World J Gastrointest Surg. Sep 27, 2026; 18(9): 119675
Published online Sep 27, 2026. doi: 10.4240/wjgs.119675
Published online Sep 27, 2026. doi: 10.4240/wjgs.119675
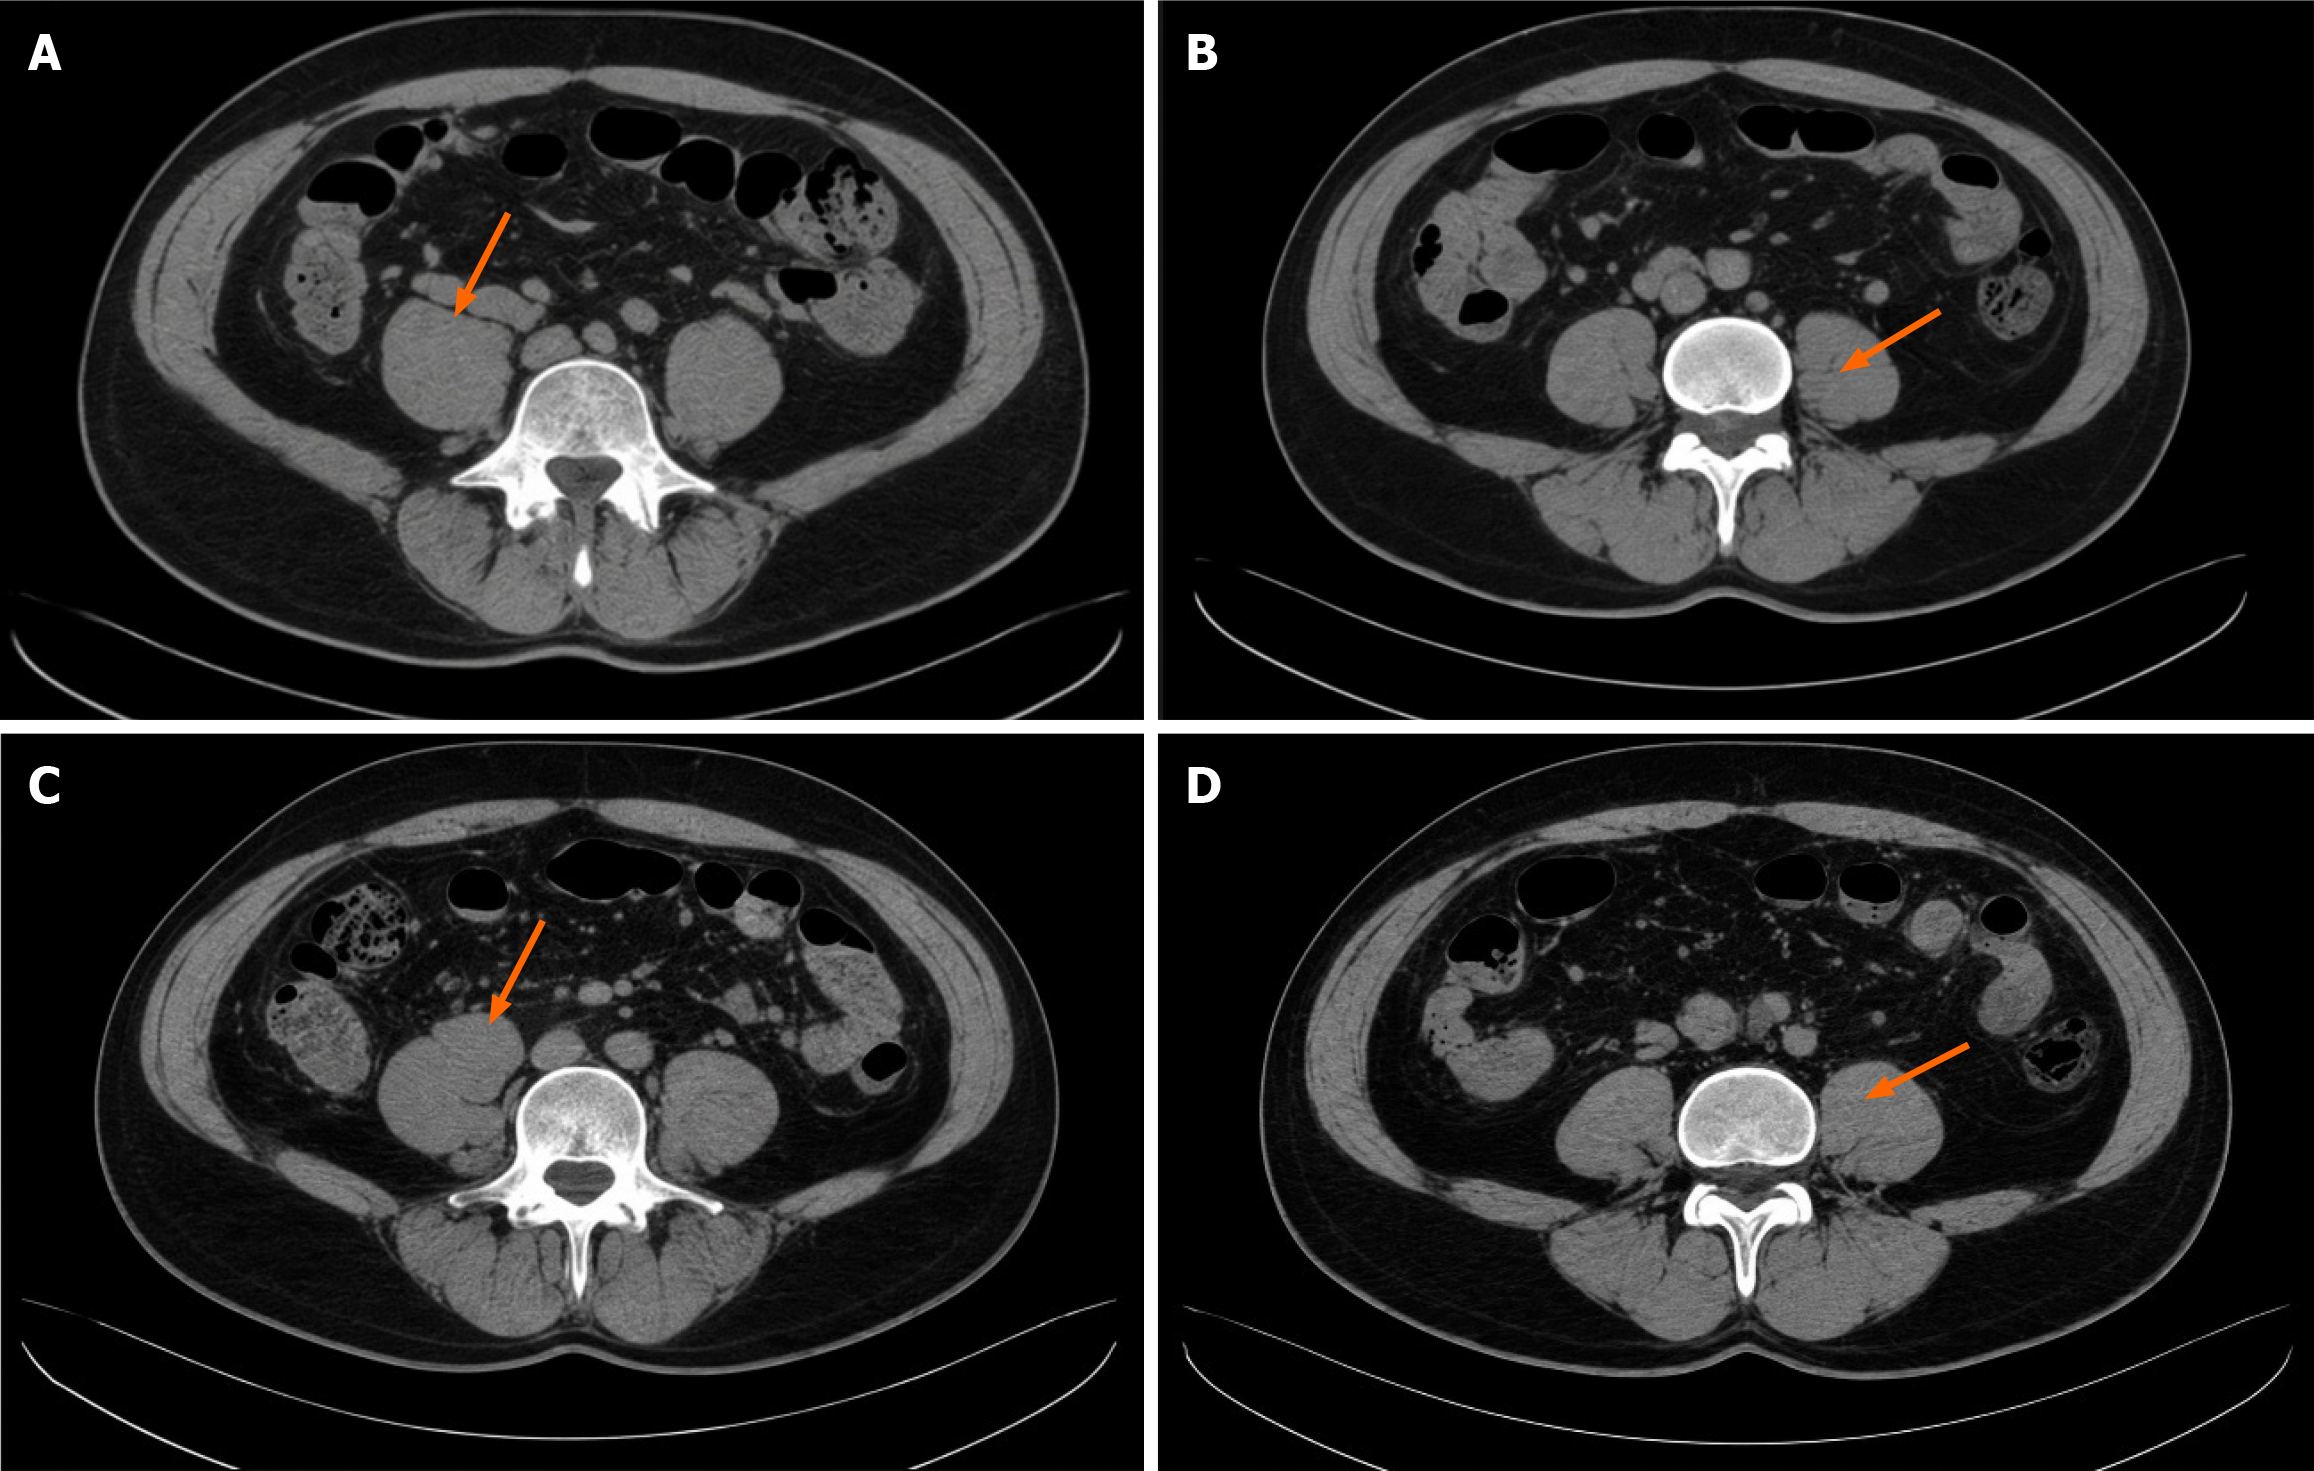
Figure 6 Representative imaging comparisons highlighting features associated with different outcomes.
This figure compares patients with divergent postoperative outcomes, underscoring the imaging basis for risk stratification. A: Preoperative computed tomography (CT) image of a patient who subsequently developed delayed intestinal function recovery, showing T3N1M0 rectal cancer (arrow). The patient had preoperative hypoalbuminemia and significant intraoperative blood loss; B: Preoperative CT image of a patient with uncomplicated normal recovery of intestinal function showing T2N0M0 colon cancer (arrow). The patient had normal preoperative albumin levels and minimal blood loss; C: Preoperative CT image of a patient in the lymph node metastasis-positive group showing a bulky, poorly differentiated T4aN2 tumor (arrow) with extramural vascular invasion; D: Preoperative CT image of a patient from the lymph node metastasis-negative group showing a well-demarcated T3N0 tumor (arrow). The contrasting features of tumor stage, size, and morphology between these pairs visually represent the risk profiles identified by the prediction models.
- Citation: Qiang JH, Cheng J, Meng F, Zhang SQ. Application of multivariate logistic regression in predicting postoperative intestinal function recovery and lymph node metastasis in colorectal cancer. World J Gastrointest Surg 2026; 18(9): 119675
- URL: https://www.wjgnet.com/1948-9366/full/v18/i9/119675.htm
- DOI: https://dx.doi.org/10.4240/wjgs.119675