
















Copyright: ©Author(s) 2026.
World J Gastrointest Surg. Sep 27, 2026; 18(9): 119258
Published online Sep 27, 2026. doi: 10.4240/wjgs.119258
Published online Sep 27, 2026. doi: 10.4240/wjgs.119258
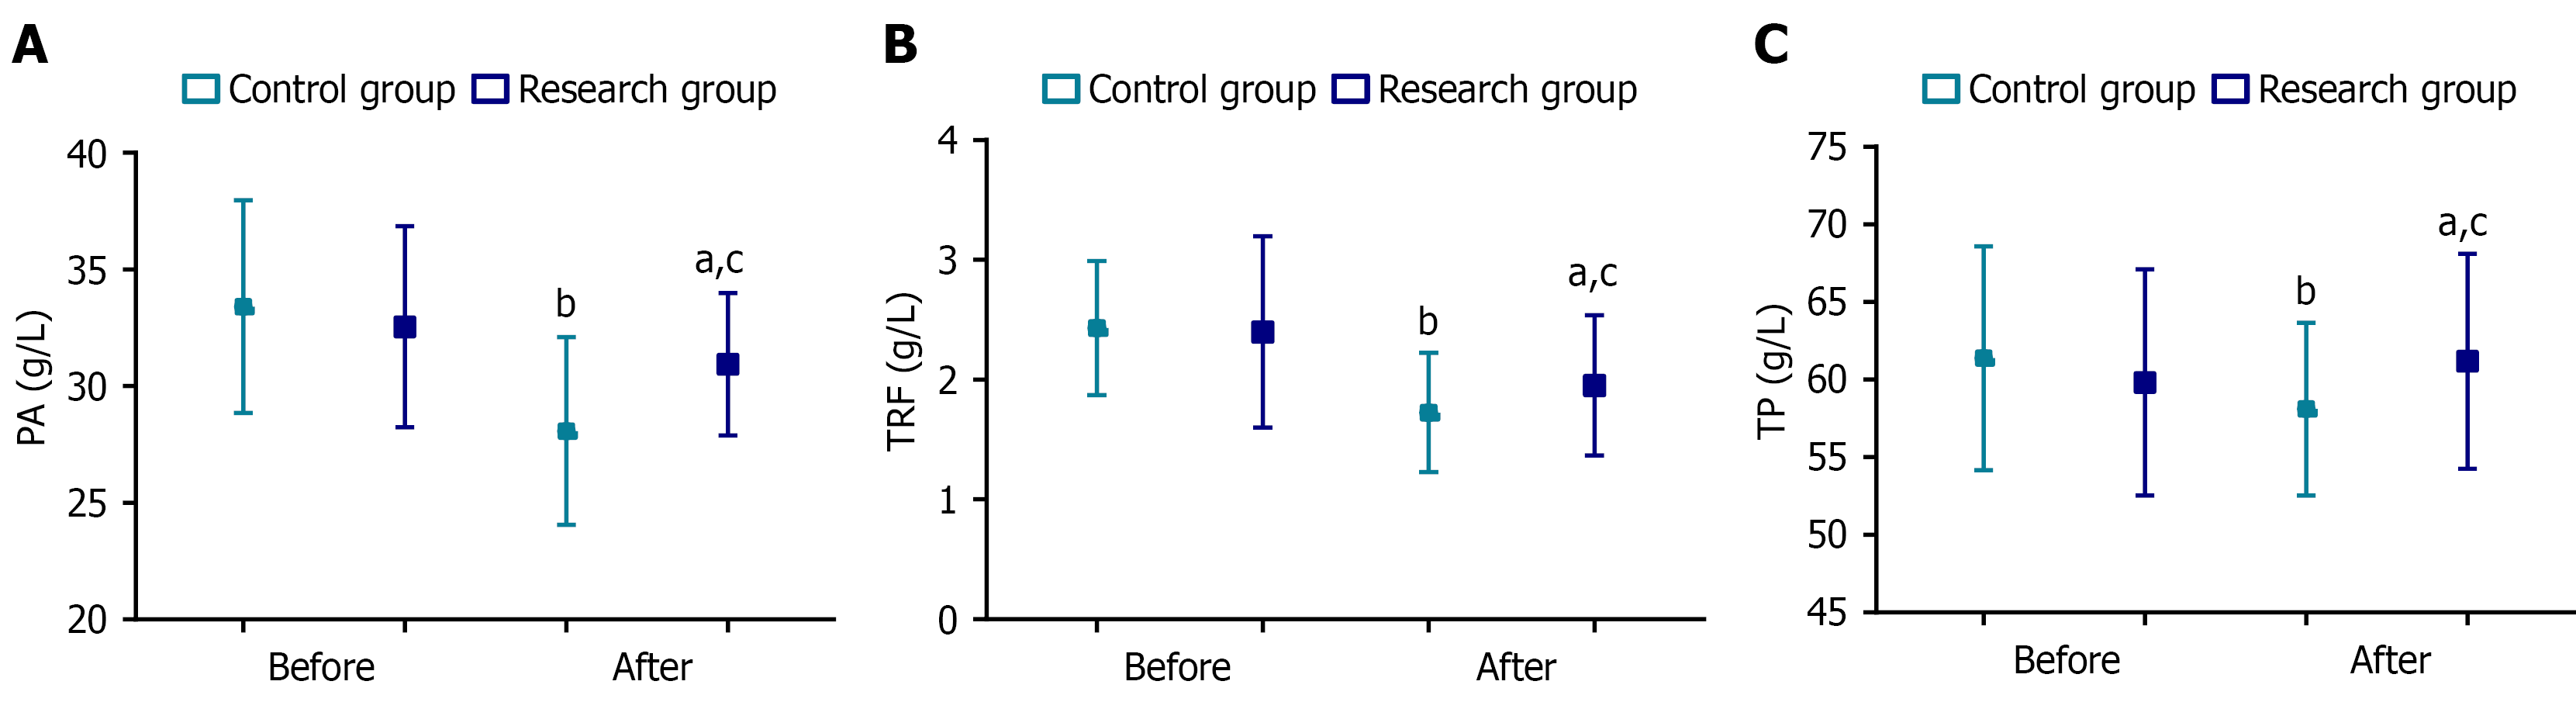
Figure 2 Comparative analysis of nutritional indicators.
aP < 0.05 vs before treatment; bP < 0.01 vs before treatment; cP < 0.05 vs the control group. A: Pre-treatment and post-treatment prealbumin in the control group and the research group; B: Pre-treatment and post-treatment transferrin in the control group and the research group; C: Pre-treatment and post-treatment total protein in the control group and the research group. PA: Prealbumin; TRF: Transferrin; TP: Total protein.
- Citation: Zhang LY, Duan LC, Xue MF, Lang CY. Effects of perioperative early enteral nutrition and glycemic control in patients with diabetes mellitus complicated with gastric cancer. World J Gastrointest Surg 2026; 18(9): 119258
- URL: https://www.wjgnet.com/1948-9366/full/v18/i9/119258.htm
- DOI: https://dx.doi.org/10.4240/wjgs.119258