
















Copyright: ©Author(s) 2026.
World J Gastrointest Surg. Sep 27, 2026; 18(9): 118865
Published online Sep 27, 2026. doi: 10.4240/wjgs.118865
Published online Sep 27, 2026. doi: 10.4240/wjgs.118865
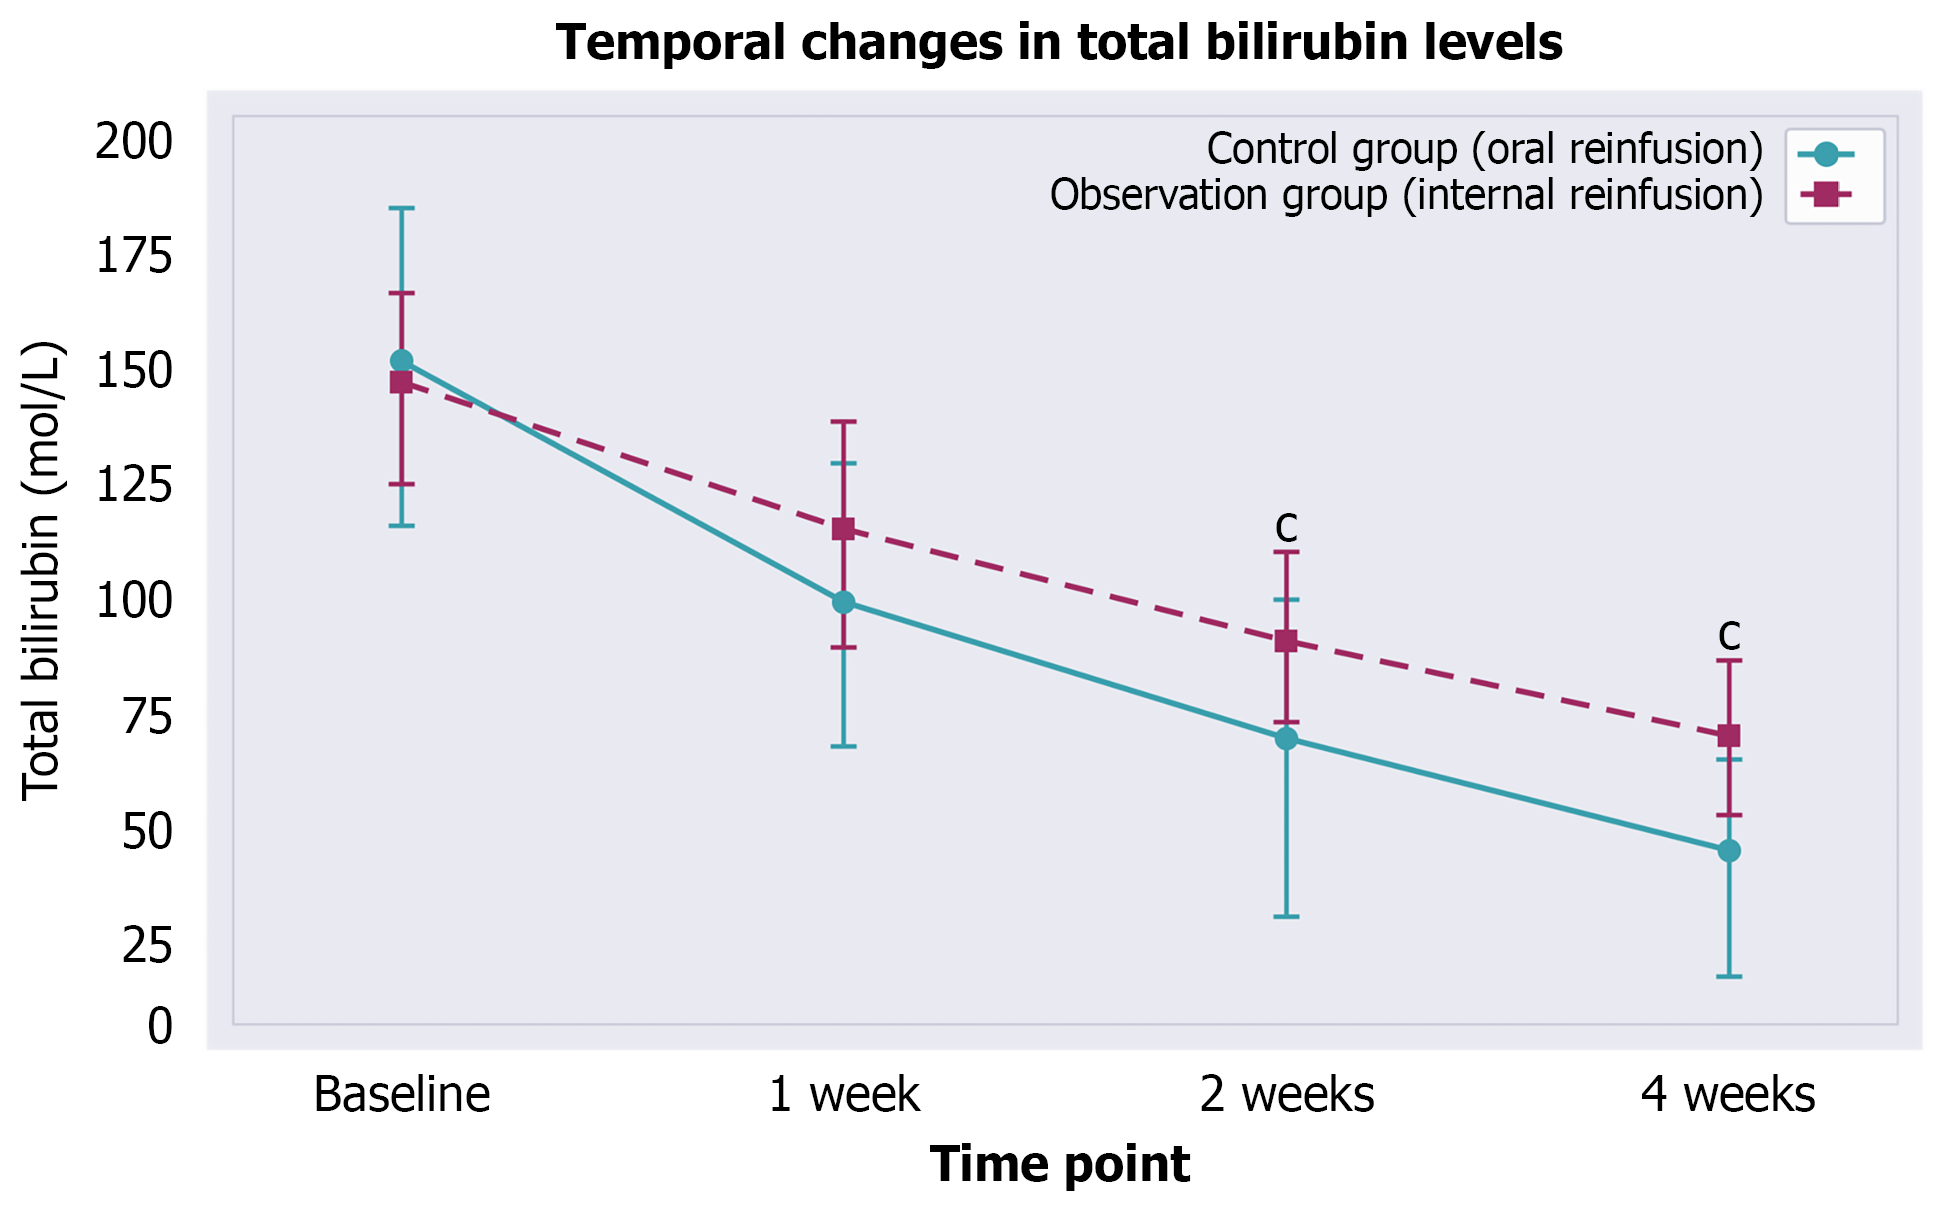
Figure 1 Temporal changes in total bilirubin levels.
Changes in serum total bilirubin levels over time in patients receiving internal bile reinfusion (observation group, blue line with circles) vs oral bile reinfusion (control group, red dashed line with squares). The observation group demonstrated significantly greater reduction in bilirubin at all time points following initiation of reinfusion (P = 0.001 at 1 week; P < 0.001 at 2 weeks and 4 weeks). Error bars represent standard deviation. cP < 0.001 between groups.
- Citation: Wang Y, Xi JW, Zhang WS, Wu QL, Liu F, Xie YL, Cao ZL. Internal vs oral bile reinfusion for hepatic recovery after percutaneous transhepatic cholangiodrainage. World J Gastrointest Surg 2026; 18(9): 118865
- URL: https://www.wjgnet.com/1948-9366/full/v18/i9/118865.htm
- DOI: https://dx.doi.org/10.4240/wjgs.118865