
















Copyright: ©Author(s) 2026.
World J Gastrointest Surg. Sep 27, 2026; 18(9): 118081
Published online Sep 27, 2026. doi: 10.4240/wjgs.118081
Published online Sep 27, 2026. doi: 10.4240/wjgs.118081
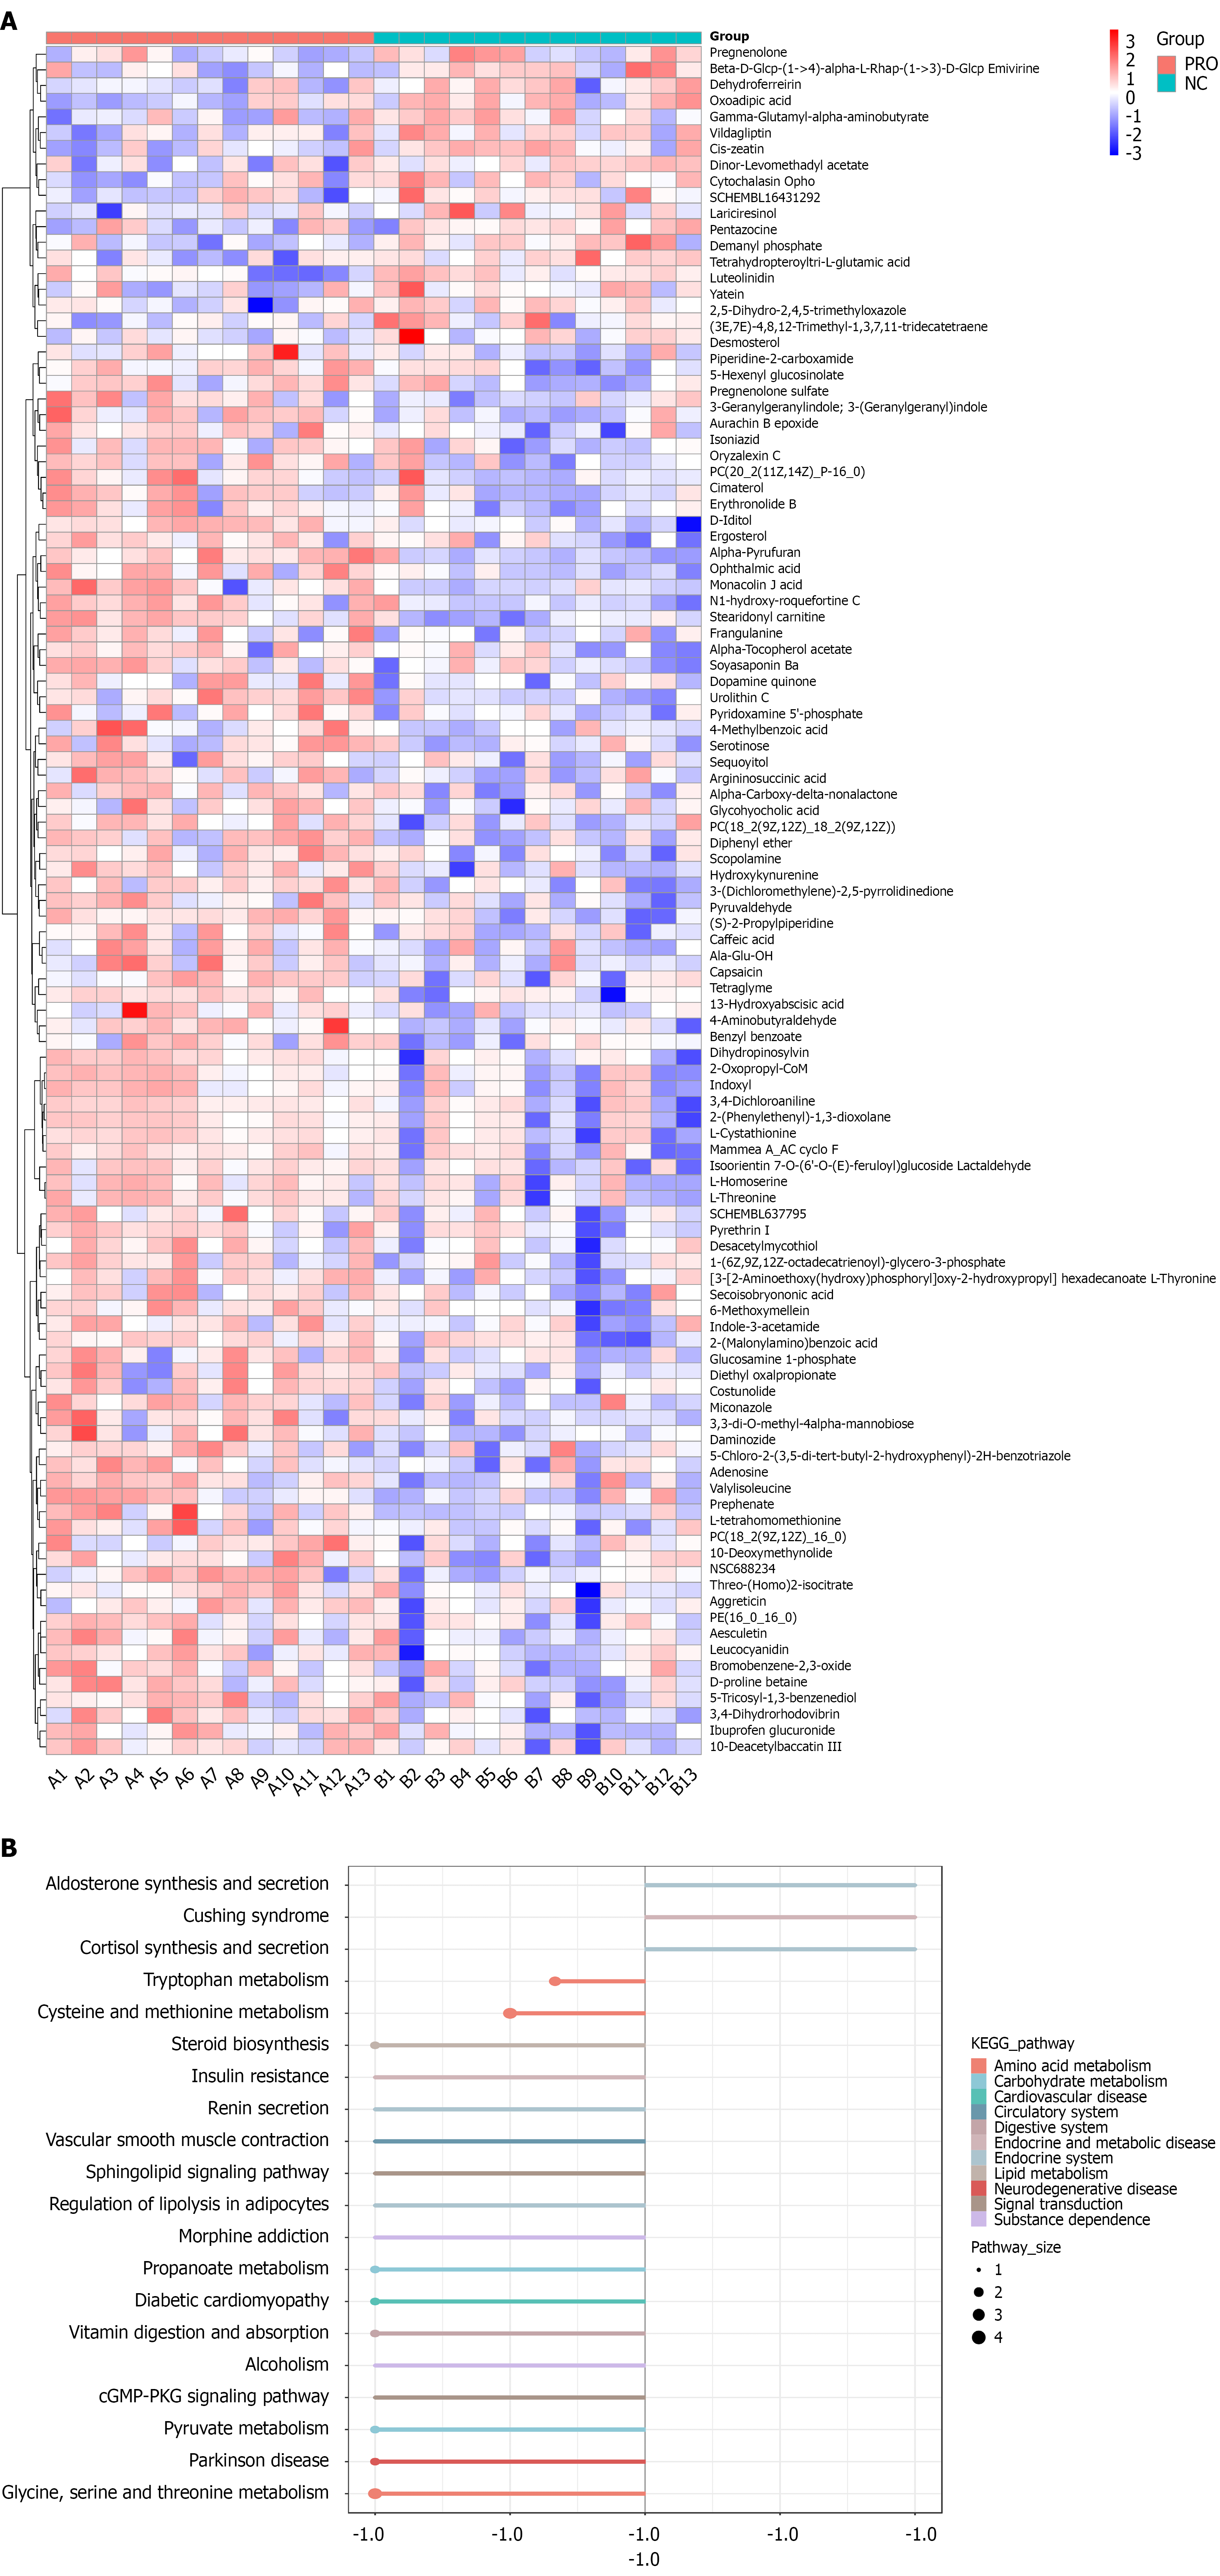
Figure 4 The pathway enrichment analysis of the MS2 differentially abundant metabolites.
A: The heatmap of the differentially abundant metabolites. Variable Importance in Projection > 1 and P < 0.05 were significantly different metabolites; B: In the differential enrichment score plot, the horizontal axis represents the DA score, where DA score = (number of substances with increased levels - number of substances with decreased levels)/total number of differentially regulated substances in the pathway. The columns on the left and right represent the pathways inhibited and activated in the probiotic group. NC group: Control group; PRO group: Probiotic group; KEGG: Kyoto Encyclopedia of Genes and Genomes.
- Citation: Chen XF, Zhang HY, Gao PQ, Zhuang FN, Chen WJ, Wang F. Multi-omics reveal the effects of probiotics on the postoperative rehabilitation of patients with esophageal cancer. World J Gastrointest Surg 2026; 18(9): 118081
- URL: https://www.wjgnet.com/1948-9366/full/v18/i9/118081.htm
- DOI: https://dx.doi.org/10.4240/wjgs.118081