
















Copyright: ©Author(s) 2026.
World J Gastrointest Surg. Sep 27, 2026; 18(9): 118081
Published online Sep 27, 2026. doi: 10.4240/wjgs.118081
Published online Sep 27, 2026. doi: 10.4240/wjgs.118081
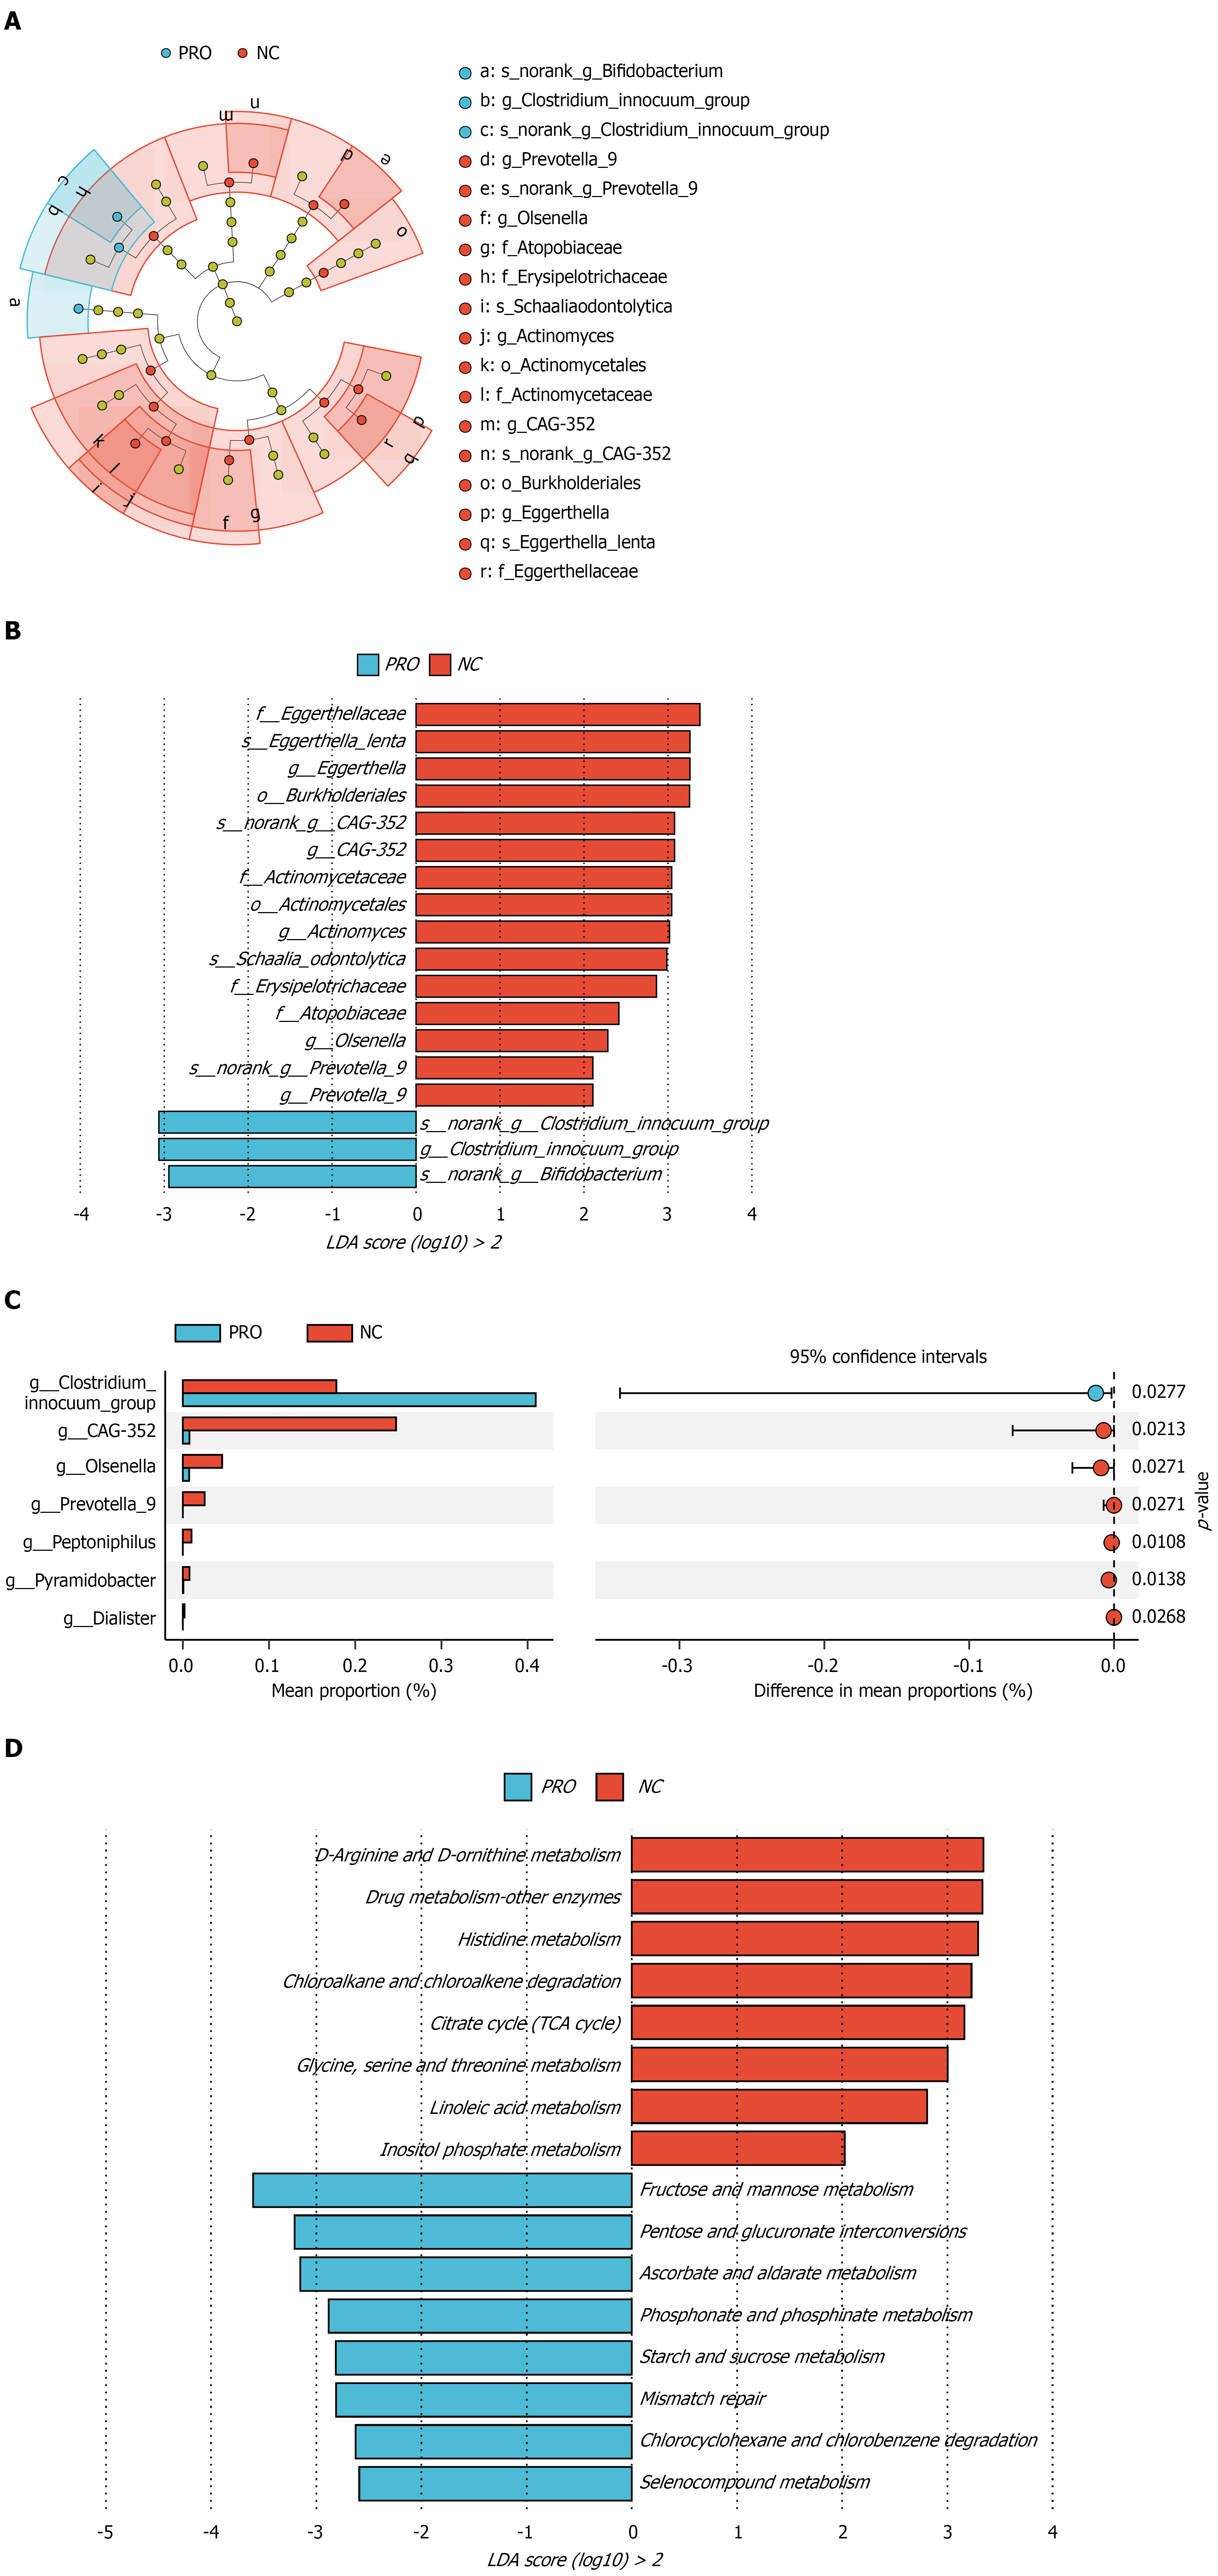
Figure 2 The species differences and functional analysis between probiotic and control groups.
A and B: Intestinal microbial linear discriminant analysis effect size (LEfSe) from domain to species and linear discriminant analysis (LDA) showed scores of these specific bacteria. A significantly different biomarker with an LDA score greater than 2 and a P < 0.05 is a biomarker with a statistical difference; C: The Wilcoxon rank sum test was used to compare the characteristic abundance of bacteria between two groups of samples. The left side shows the abundance proportion of different features in each sample, the middle shows the difference effect within the 95% confidence interval, and the far right shows the P value; D: The Kyoto Encyclopedia of Genes and Genomes pathway analysis by PICRUSt2 and LEfSe tools were used to predict the potential function of the differential gut microbiota. A significantly different biomarker with an LDA score greater than 2 and a P < 0.05 is a biomarker with a statistical difference. NC group: Control group; PRO group: Probiotic group; LDA: Linear discriminant analysis.
- Citation: Chen XF, Zhang HY, Gao PQ, Zhuang FN, Chen WJ, Wang F. Multi-omics reveal the effects of probiotics on the postoperative rehabilitation of patients with esophageal cancer. World J Gastrointest Surg 2026; 18(9): 118081
- URL: https://www.wjgnet.com/1948-9366/full/v18/i9/118081.htm
- DOI: https://dx.doi.org/10.4240/wjgs.118081