
















Copyright: ©Author(s) 2026.
World J Gastrointest Surg. Sep 27, 2026; 18(9): 118081
Published online Sep 27, 2026. doi: 10.4240/wjgs.118081
Published online Sep 27, 2026. doi: 10.4240/wjgs.118081
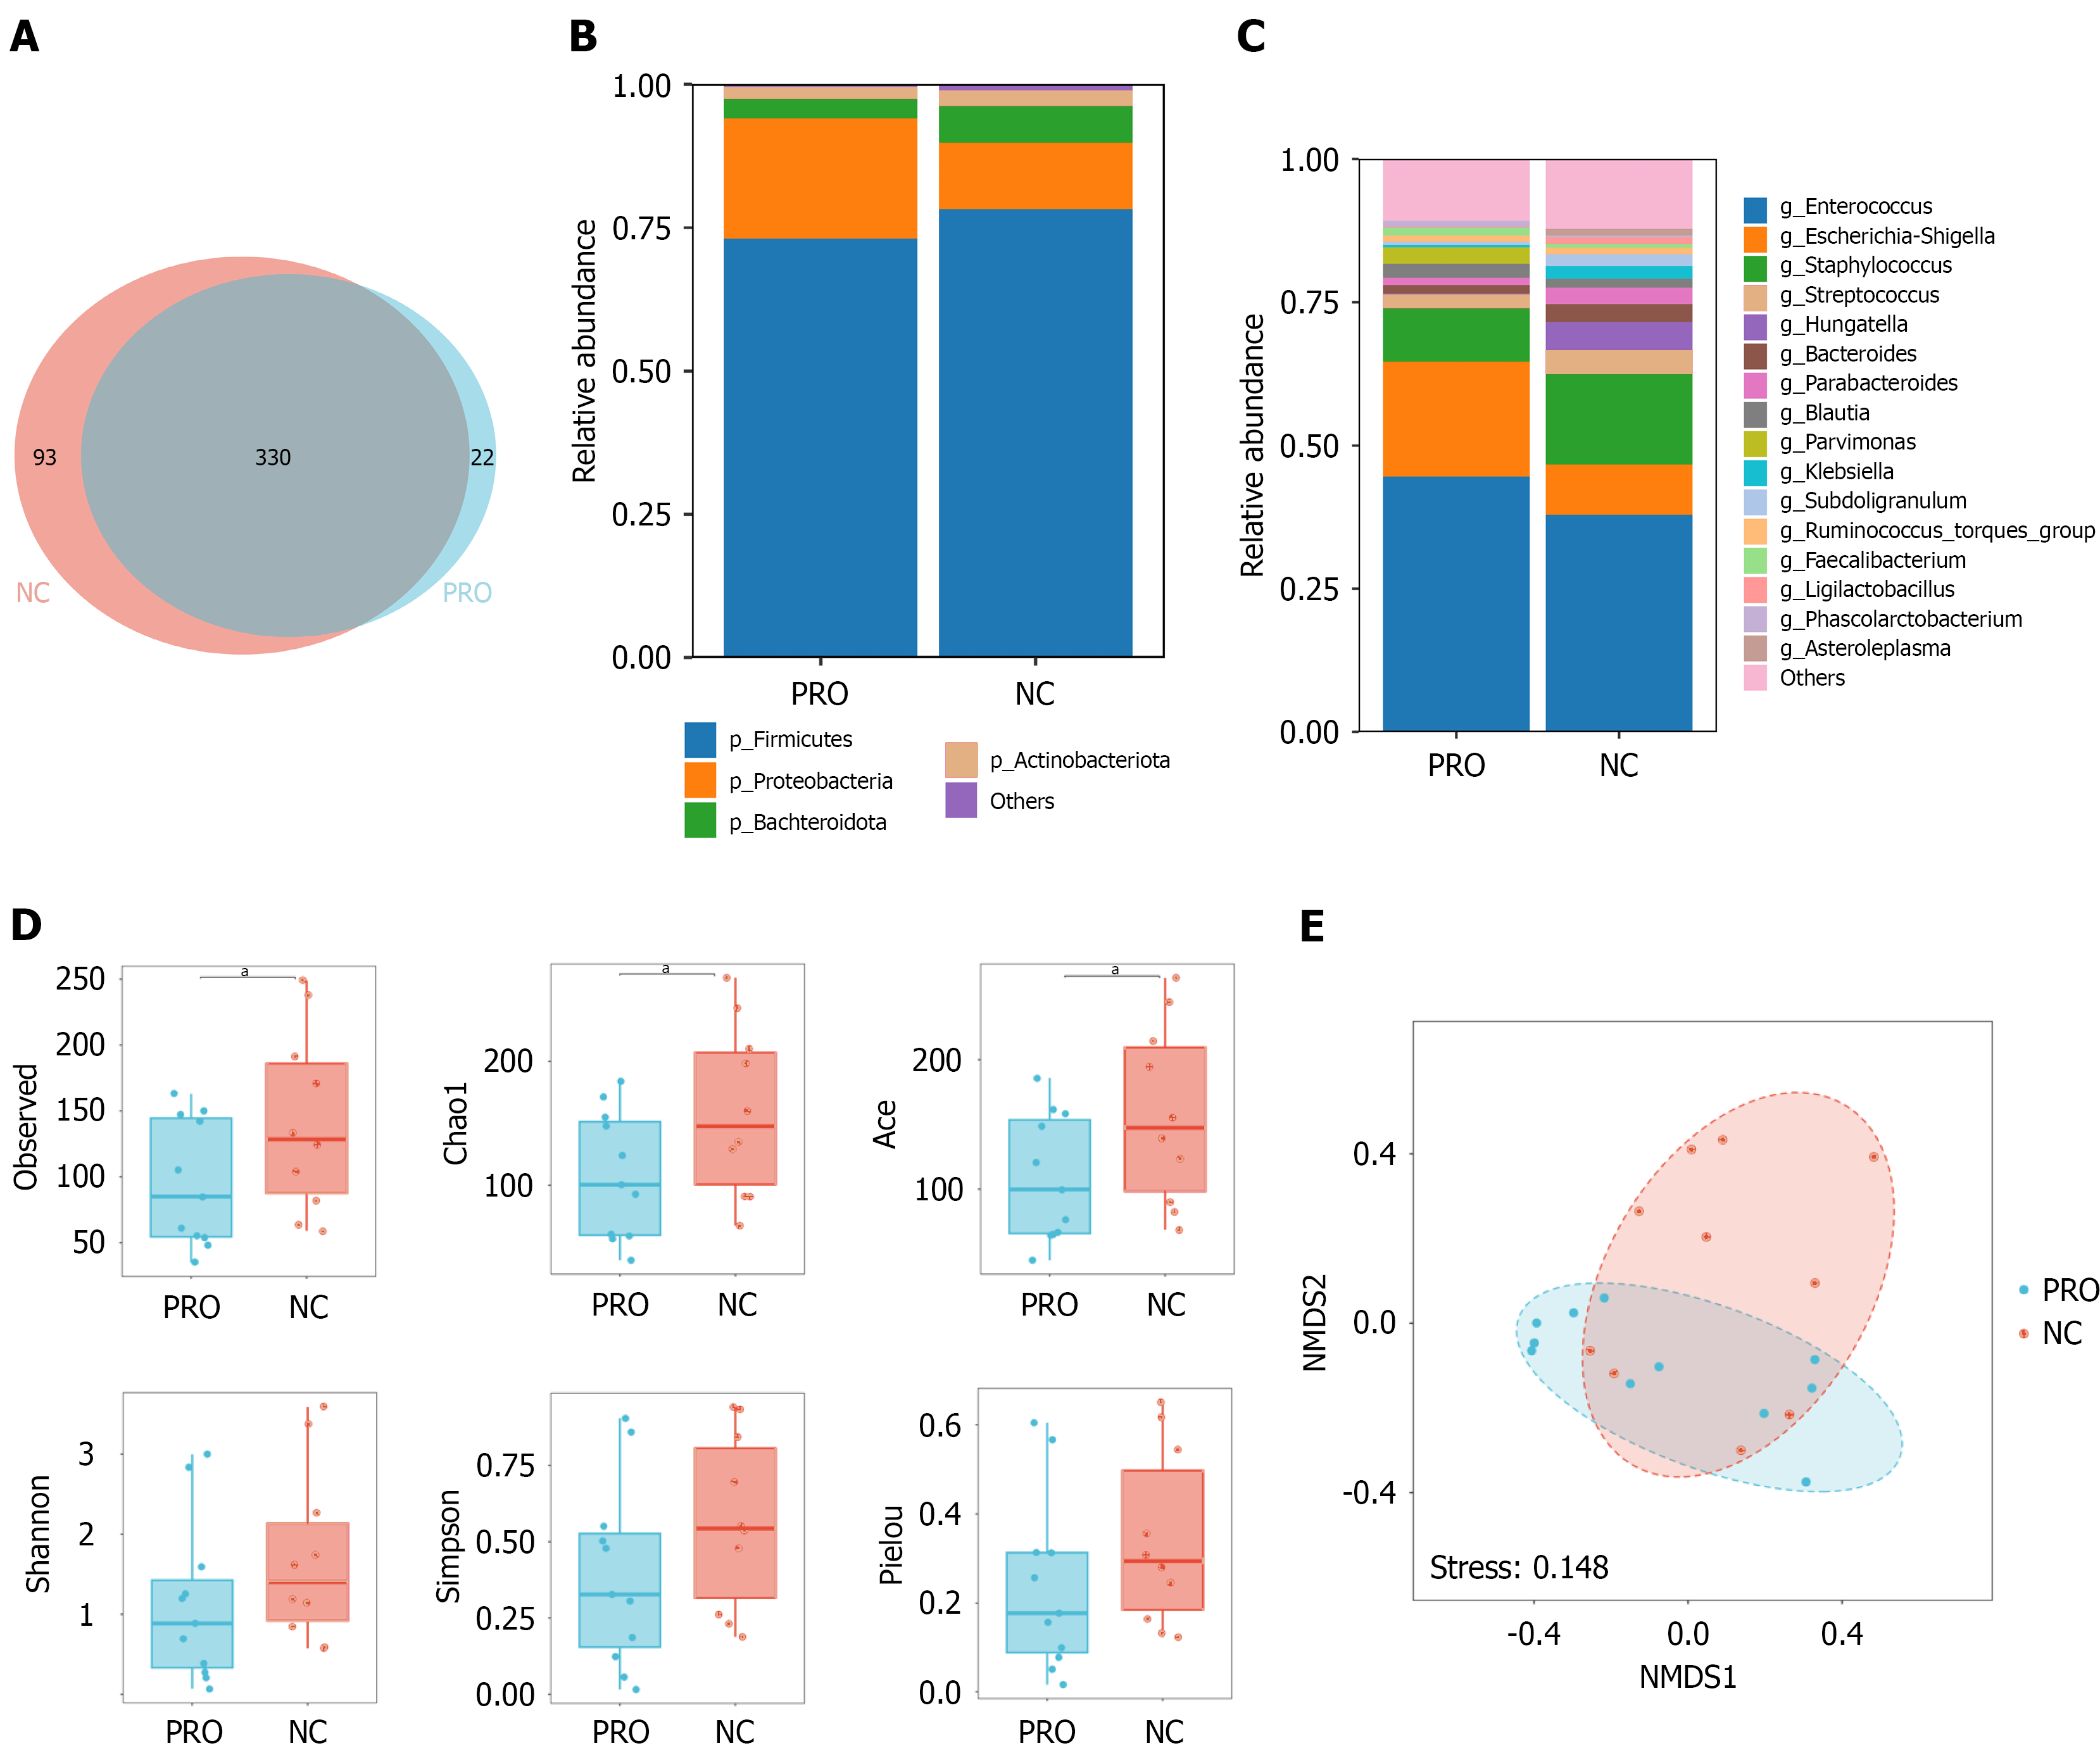
Figure 1 Species composition and diversity analysis in intestinal microbial populations between probiotic and control groups.
A: The Venn chart showed the number of operational taxonomic units between probiotic and control group; B and C: Relative gut microbiota abundance at phylum (B) and genus (C) level; D: Distribution of alpha diversity in each sample group. The horizontal coordinate represents the sample grouping, and the vertical coordinate represents the diversity index value. aP < 0.05; E: For nonmetric multidimensional scaling analysis, points in the nonmetric multidimensional scaling graph represent the sample, and different colors/shapes represent the group information to which the sample belongs. The distance between the lines of each sample point reflects the similarity between each sample. The shorter the distance, the greater the similarity. NC group: Control group; PRO group: Probiotic group; NMDS: Nonmetric multidimensional scaling.
- Citation: Chen XF, Zhang HY, Gao PQ, Zhuang FN, Chen WJ, Wang F. Multi-omics reveal the effects of probiotics on the postoperative rehabilitation of patients with esophageal cancer. World J Gastrointest Surg 2026; 18(9): 118081
- URL: https://www.wjgnet.com/1948-9366/full/v18/i9/118081.htm
- DOI: https://dx.doi.org/10.4240/wjgs.118081