
















Copyright: ©Author(s) 2026.
World J Gastrointest Surg. Aug 27, 2026; 18(8): 121016
Published online Aug 27, 2026. doi: 10.4240/wjgs.121016
Published online Aug 27, 2026. doi: 10.4240/wjgs.121016
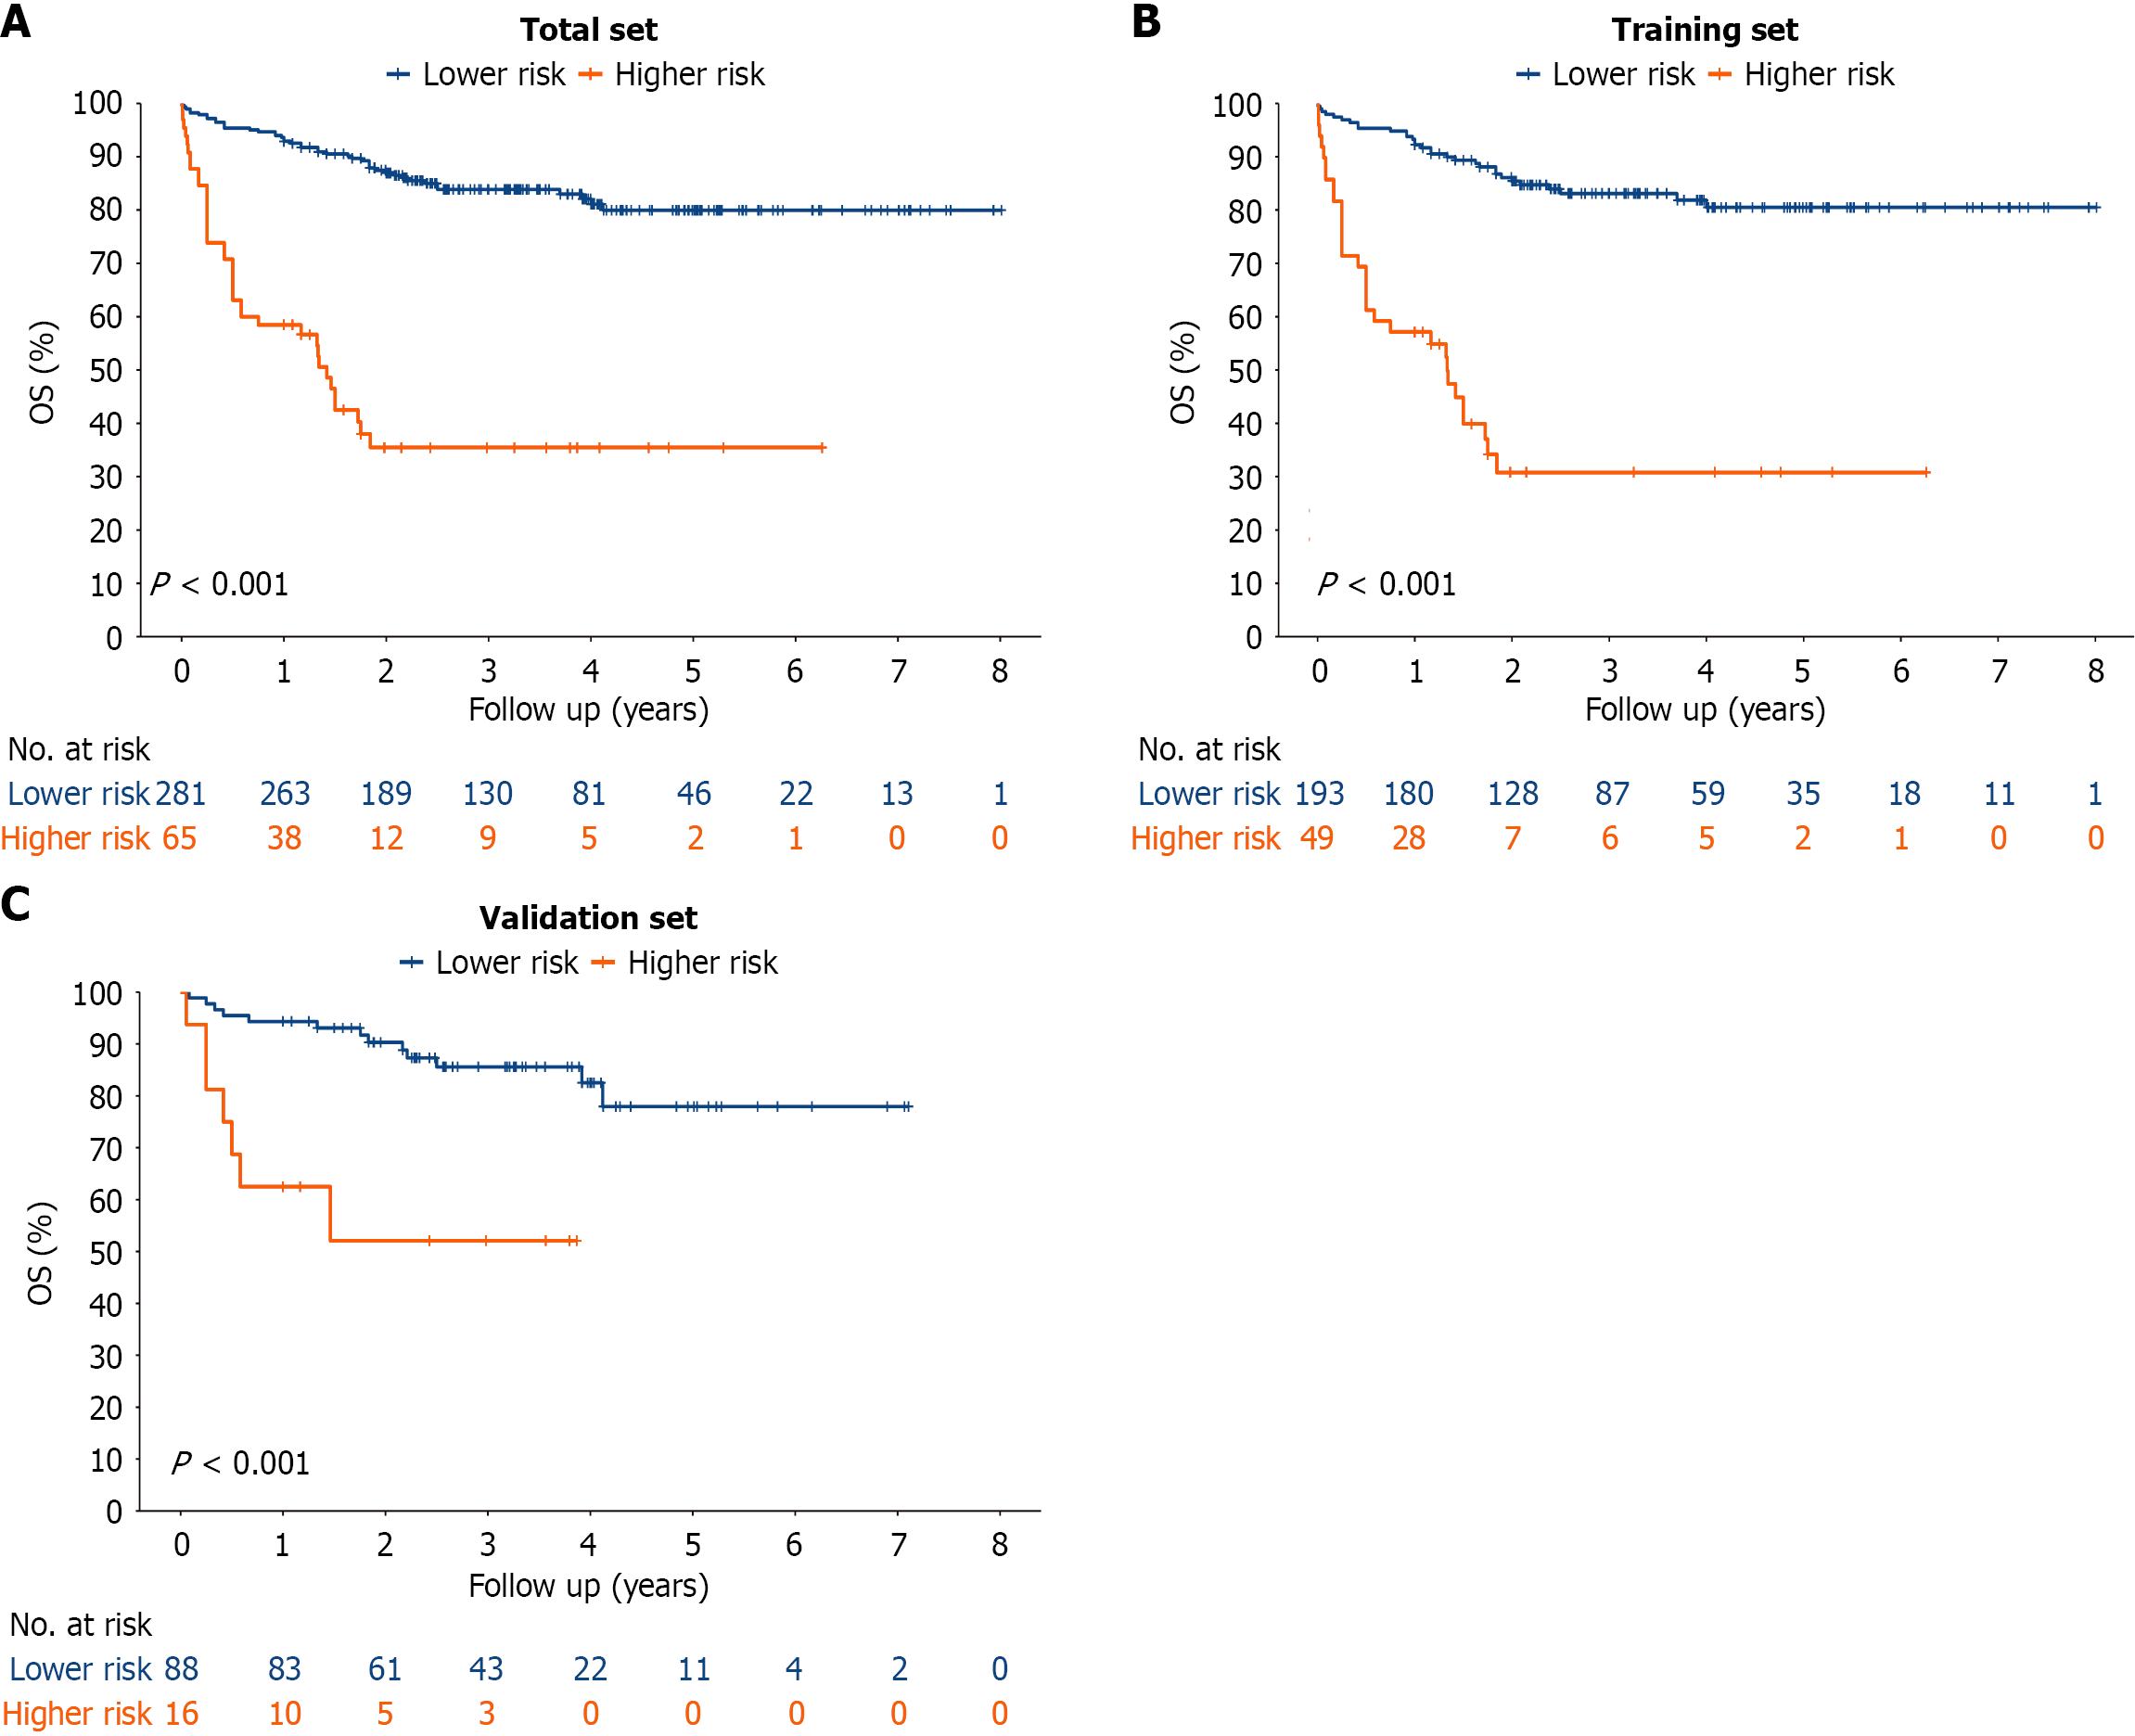
Figure 4 Kaplan-Meier curve for overall survival of patients after the transjugular intrahepatic portosystemic shunt procedure in low-risk and high-risk groups stratified according to the nomogram prediction model.
A-C: The survival curves for the total set (A), the training cohort (B), and validation set (C), based on an optimal cutoff point for low- and high-risk groups. OS: Overall survival.
- Citation: Yin L, Zhang JQ, Zhu YJ, Chu SL, Liu KC, Zhang P, Dong L, Zhang YH, Lu D, Lv WF, Zhou CZ, Cheng DL. Prognostic value of acute liver injury in cirrhotic patients after the transjugular intrahepatic portosystemic shunt procedure. World J Gastrointest Surg 2026; 18(8): 121016
- URL: https://www.wjgnet.com/1948-9366/full/v18/i8/121016.htm
- DOI: https://dx.doi.org/10.4240/wjgs.121016