
















Copyright: ©Author(s) 2026.
World J Gastrointest Surg. Aug 27, 2026; 18(8): 117559
Published online Aug 27, 2026. doi: 10.4240/wjgs.117559
Published online Aug 27, 2026. doi: 10.4240/wjgs.117559
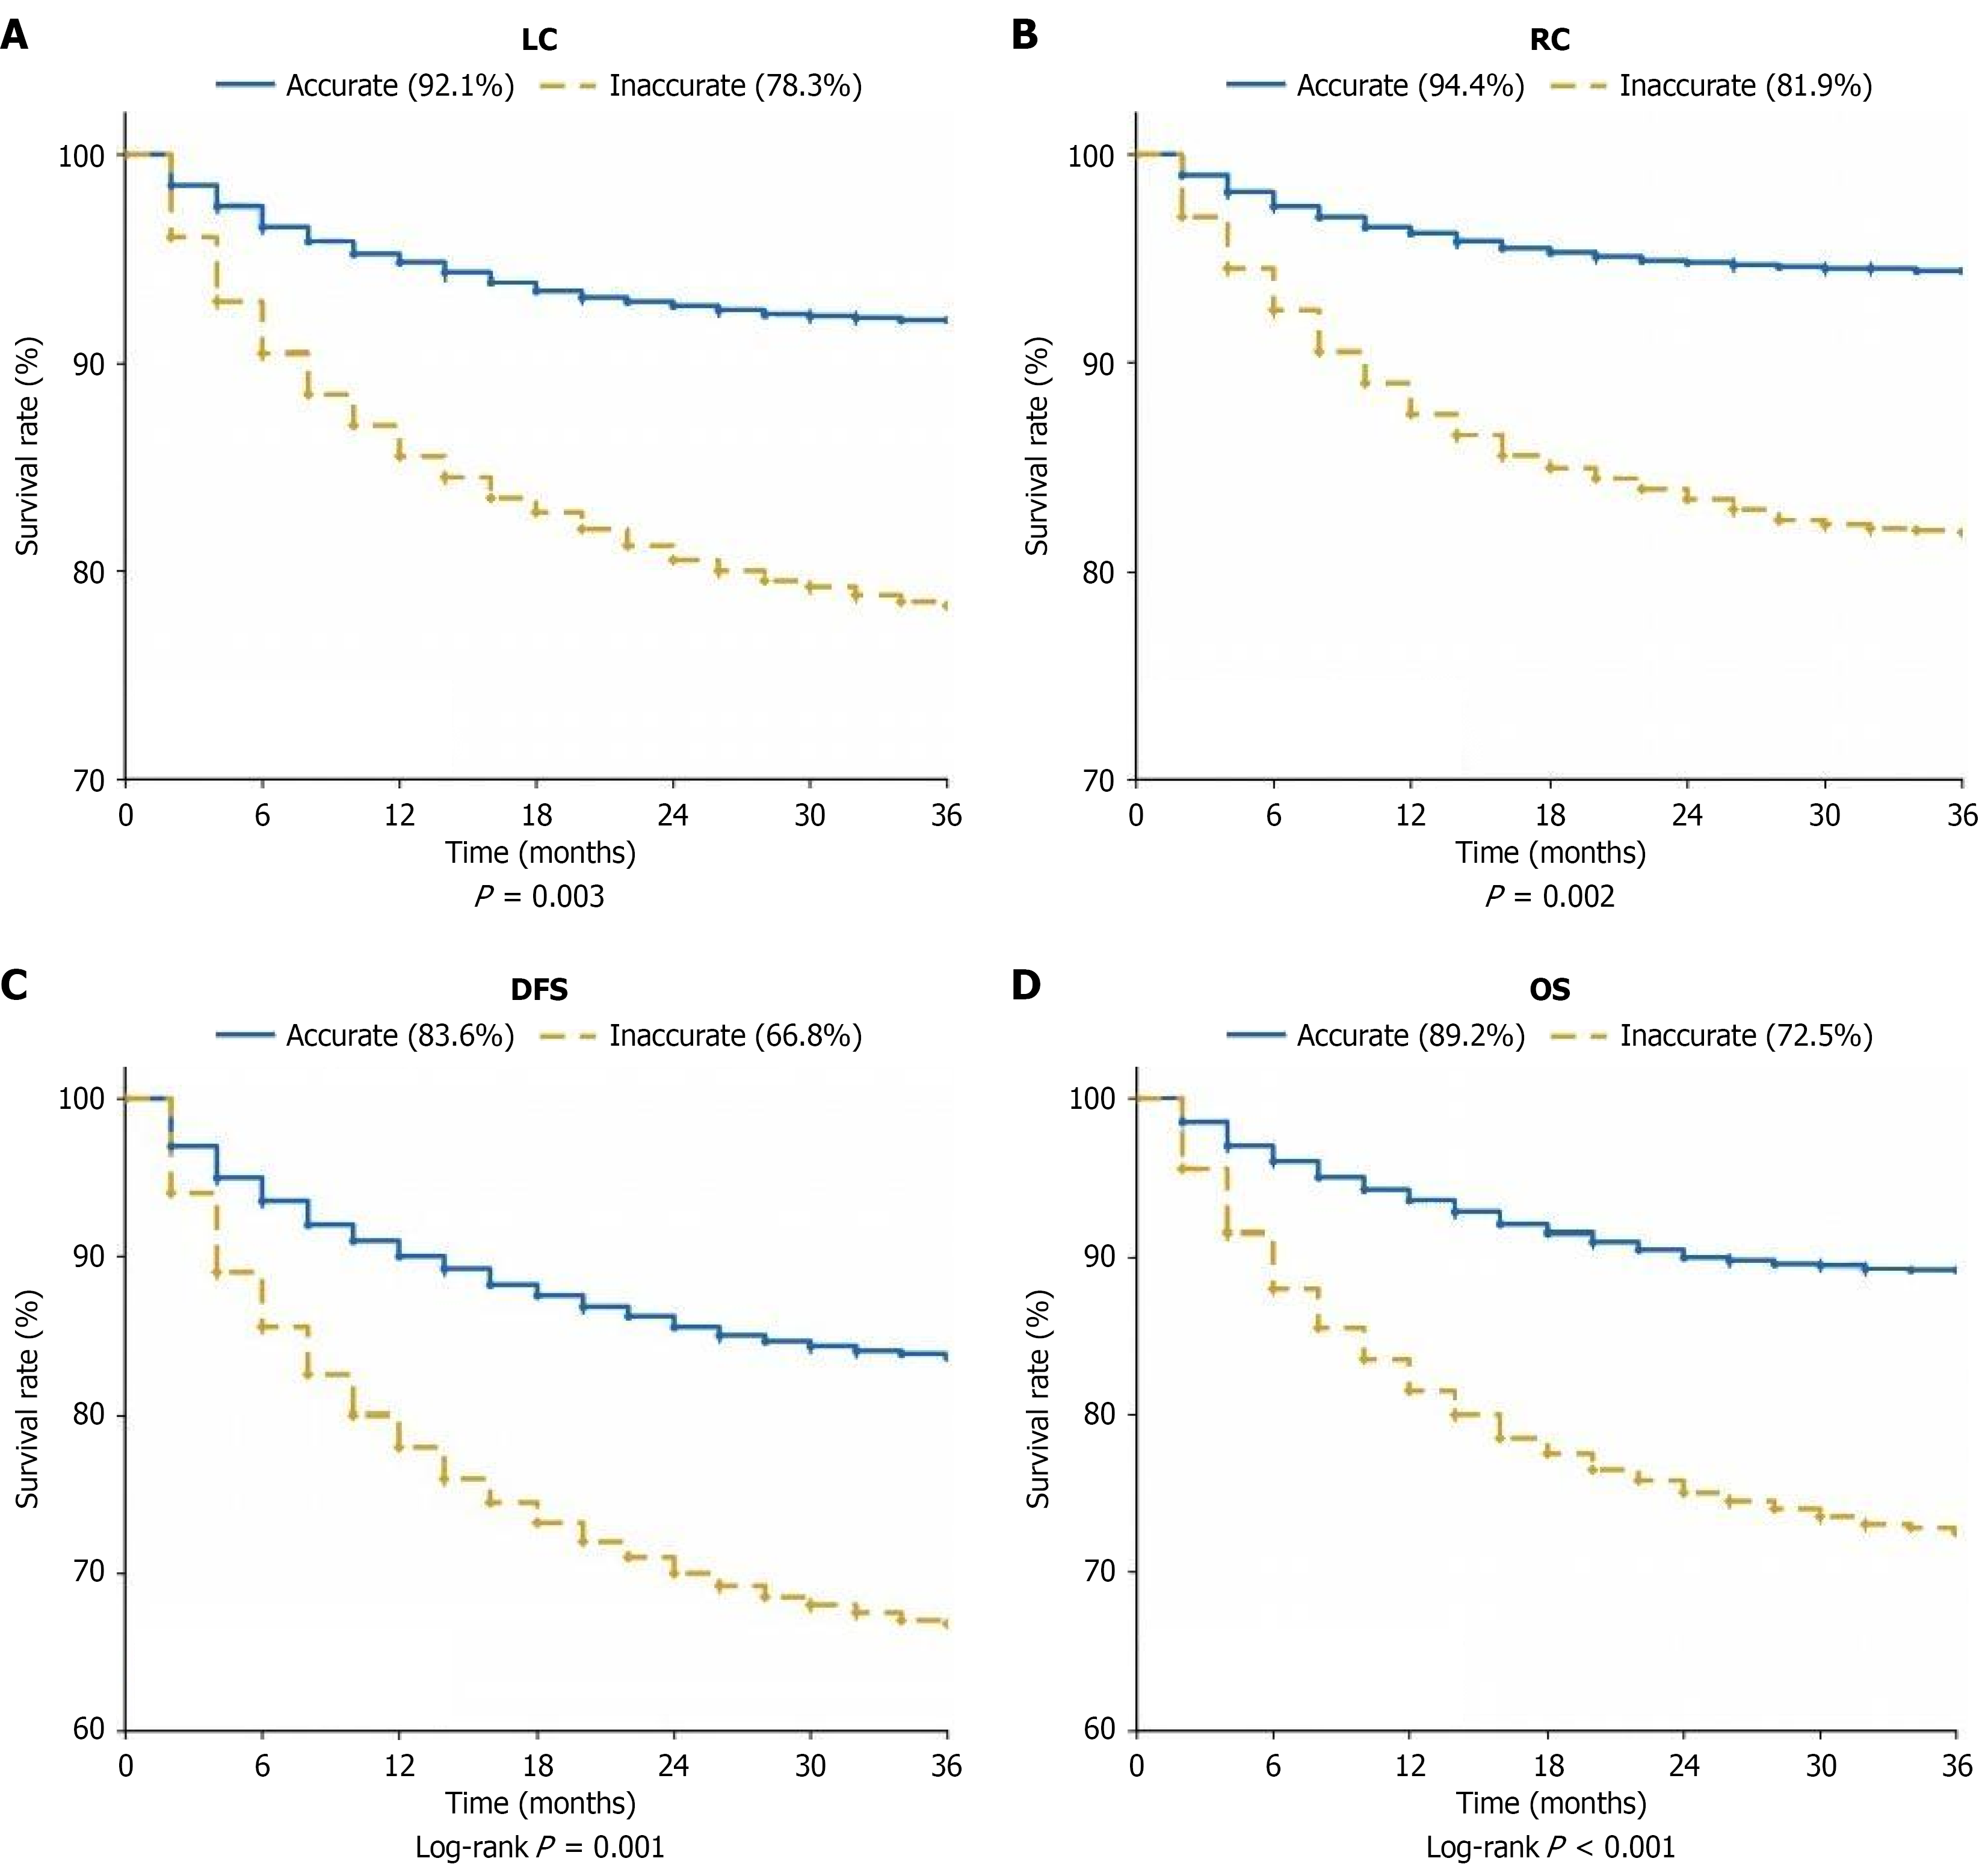
Figure 1 Kaplan-Meier survival curves comparing accurate vs inaccurate target volume delineation groups.
A: Kaplan-Meier curves for local control; B: Regional control; C: Disease-free survival; D: Overall survival stratified by target volume delineation accuracy. Blue solid lines represent the accurate delineation group, and red dashed lines represent the inaccurate delineation group. The 3-year local control, regional control, disease-free survival, and overall survival rates were 92.1% vs 78.3%, 94.4% vs 81.9%, 83.6% vs 66.8%, and 89.2% vs 72.5% for the accurate and inaccurate groups, respectively. Patients with accurate target volume delineation demonstrated significantly superior outcomes across all four endpoints (all log-rank P < 0.005). LC: Local control; RC: Regional control; DFS: Disease-free survival; OS: Overall survival.
- Citation: Xing Y, Gu M. Impact of target volume delineation accuracy on locoregional control and survival after postoperative radiotherapy for colorectal cancer. World J Gastrointest Surg 2026; 18(8): 117559
- URL: https://www.wjgnet.com/1948-9366/full/v18/i8/117559.htm
- DOI: https://dx.doi.org/10.4240/wjgs.117559