















Copyright: ©Author(s) 2026.
World J Gastrointest Surg. Jul 27, 2026; 18(7): 121443
Published online Jul 27, 2026. doi: 10.4240/wjgs.v18.i7.121443
Published online Jul 27, 2026. doi: 10.4240/wjgs.v18.i7.121443
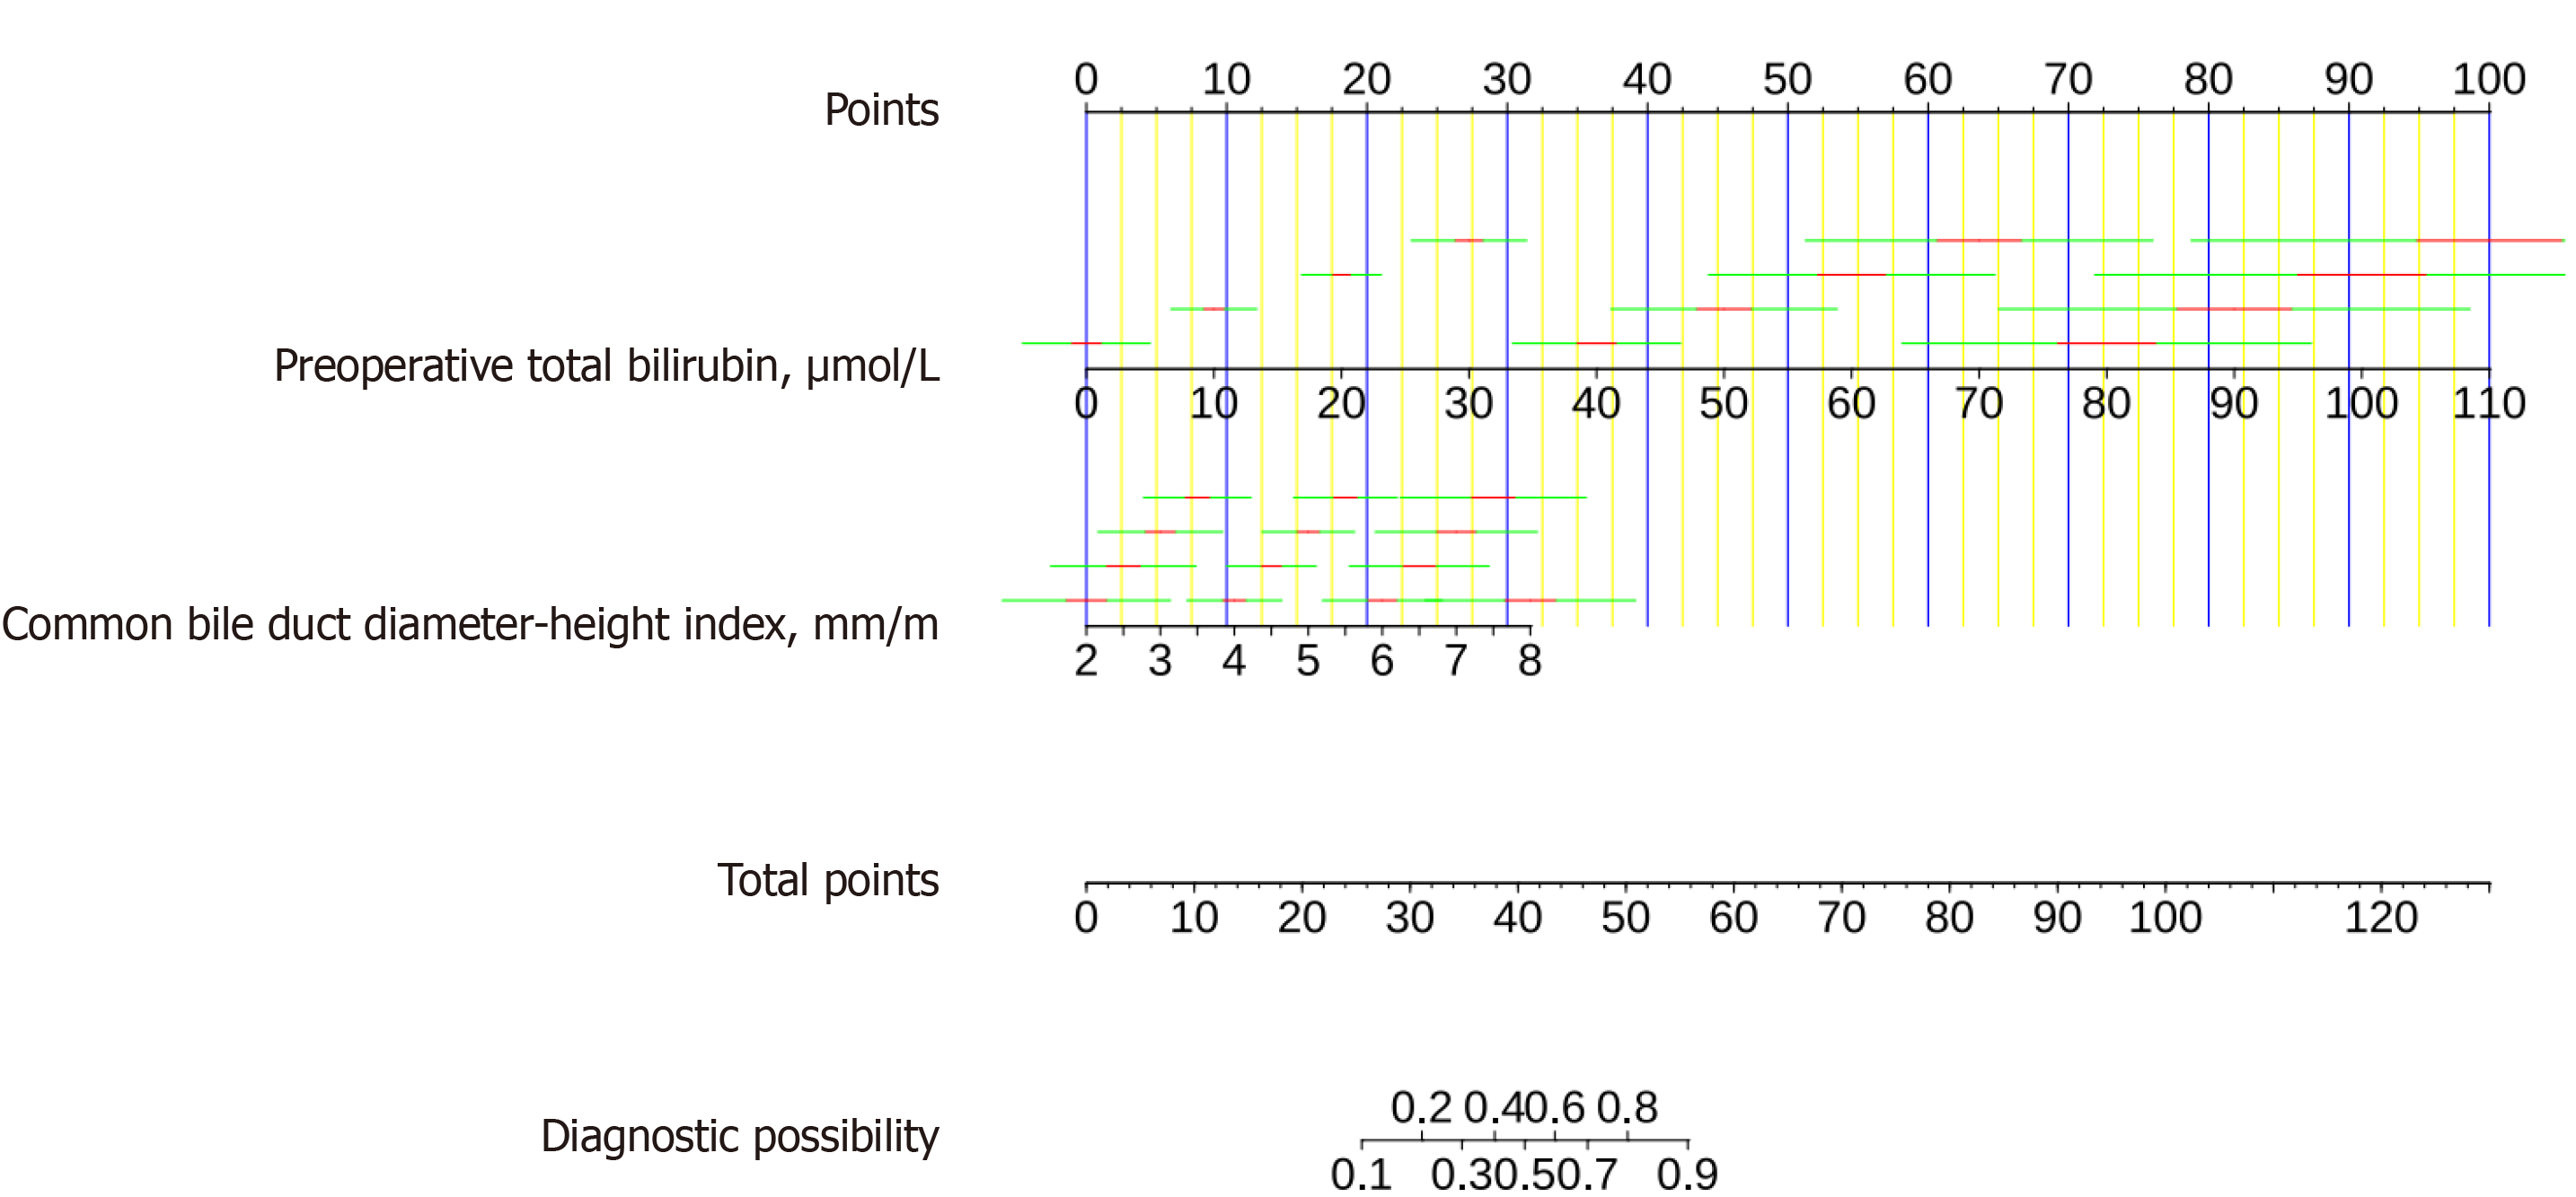
Figure 4 Nomogram based on total bilirubin and the common bile duct/height index.
The top axis represents the point scale for each predictor, the middle axis represents total points, and the bottom axis shows the corresponding predicted probability of 30-day clinically relevant biliary events. Higher total points indicate higher predicted risk.
- Citation: Chen ZP. Preoperative prediction model for 30 days biliary events after laparoscopic cholecystectomy. World J Gastrointest Surg 2026; 18(7): 121443
- URL: https://www.wjgnet.com/1948-9366/full/v18/i7/121443.htm
- DOI: https://dx.doi.org/10.4240/wjgs.v18.i7.121443