
















Copyright: ©Author(s) 2026.
World J Gastrointest Surg. Jul 27, 2026; 18(7): 120890
Published online Jul 27, 2026. doi: 10.4240/wjgs.120890
Published online Jul 27, 2026. doi: 10.4240/wjgs.120890
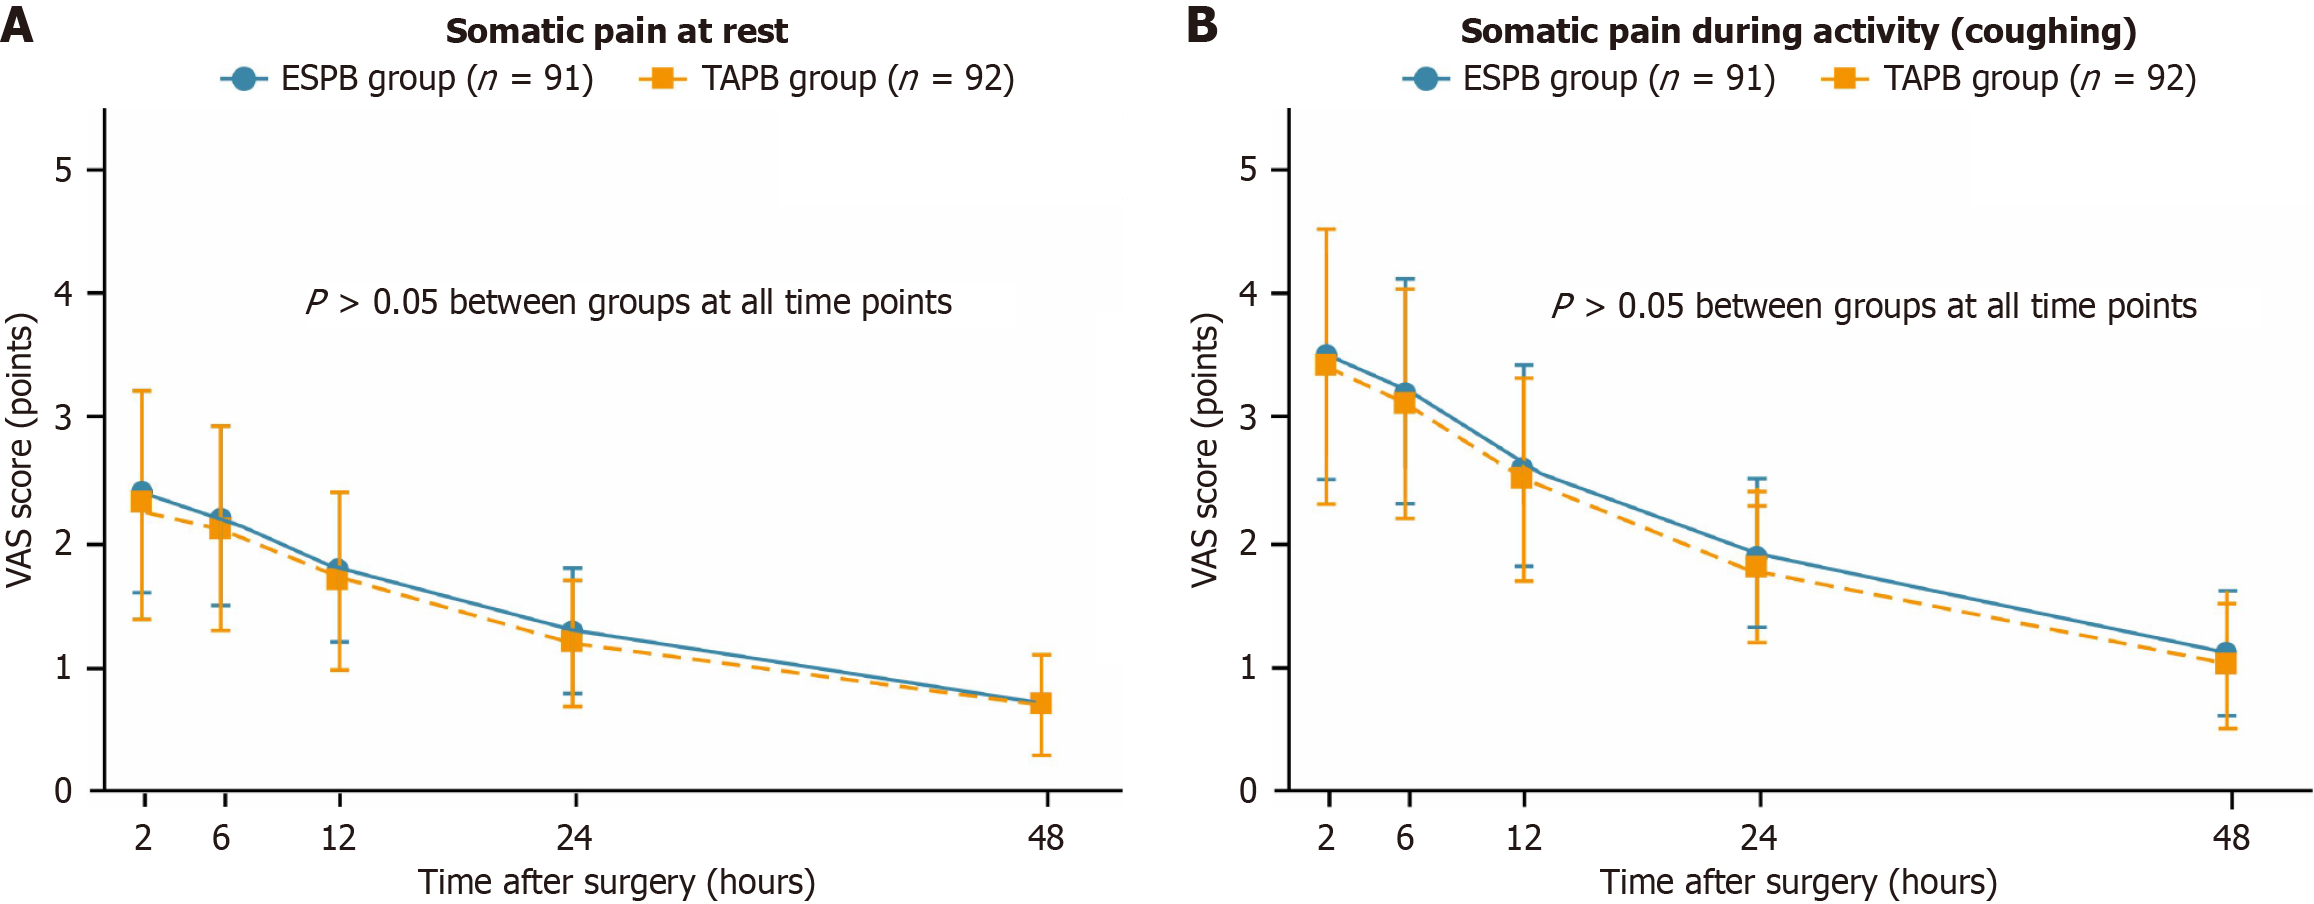
Figure 2 Comparison of postoperative somatic pain Visual Analog Scale scores between erector spinae plane block and transversus abdominis plane block groups.
This figure depicts the time course of postoperative somatic pain intensity measured by Visual Analog Scale scores over 48 hours following surgery. A: At rest; B: During activity/coughing. The blue line represents the erector spinae plane block group (n = 91), and the orange line represents the transversus abdominis plane block group (n = 92). Data are presented as mean ± SD. Both groups demonstrated comparable somatic pain control throughout the postoperative period, with gradual decline in pain scores over time. Unlike visceral pain, somatic pain intensity showed similar trajectories in both the erector spinae plane block and transversus abdominis plane block groups. ESPB: Erector spinae plane block; TAPB: Transversus abdominis plane block; VAS: Visual Analog Scale.
- Citation: Cheng H, Liu C, Li MY. Erector spinae plane block vs transversus abdominis plane block for visceral and somatic pain after laparoscopic appendectomy. World J Gastrointest Surg 2026; 18(7): 120890
- URL: https://www.wjgnet.com/1948-9366/full/v18/i7/120890.htm
- DOI: https://dx.doi.org/10.4240/wjgs.120890