
















Copyright: ©Author(s) 2026.
World J Gastrointest Surg. Jul 27, 2026; 18(7): 119733
Published online Jul 27, 2026. doi: 10.4240/wjgs.v18.i7.119733
Published online Jul 27, 2026. doi: 10.4240/wjgs.v18.i7.119733
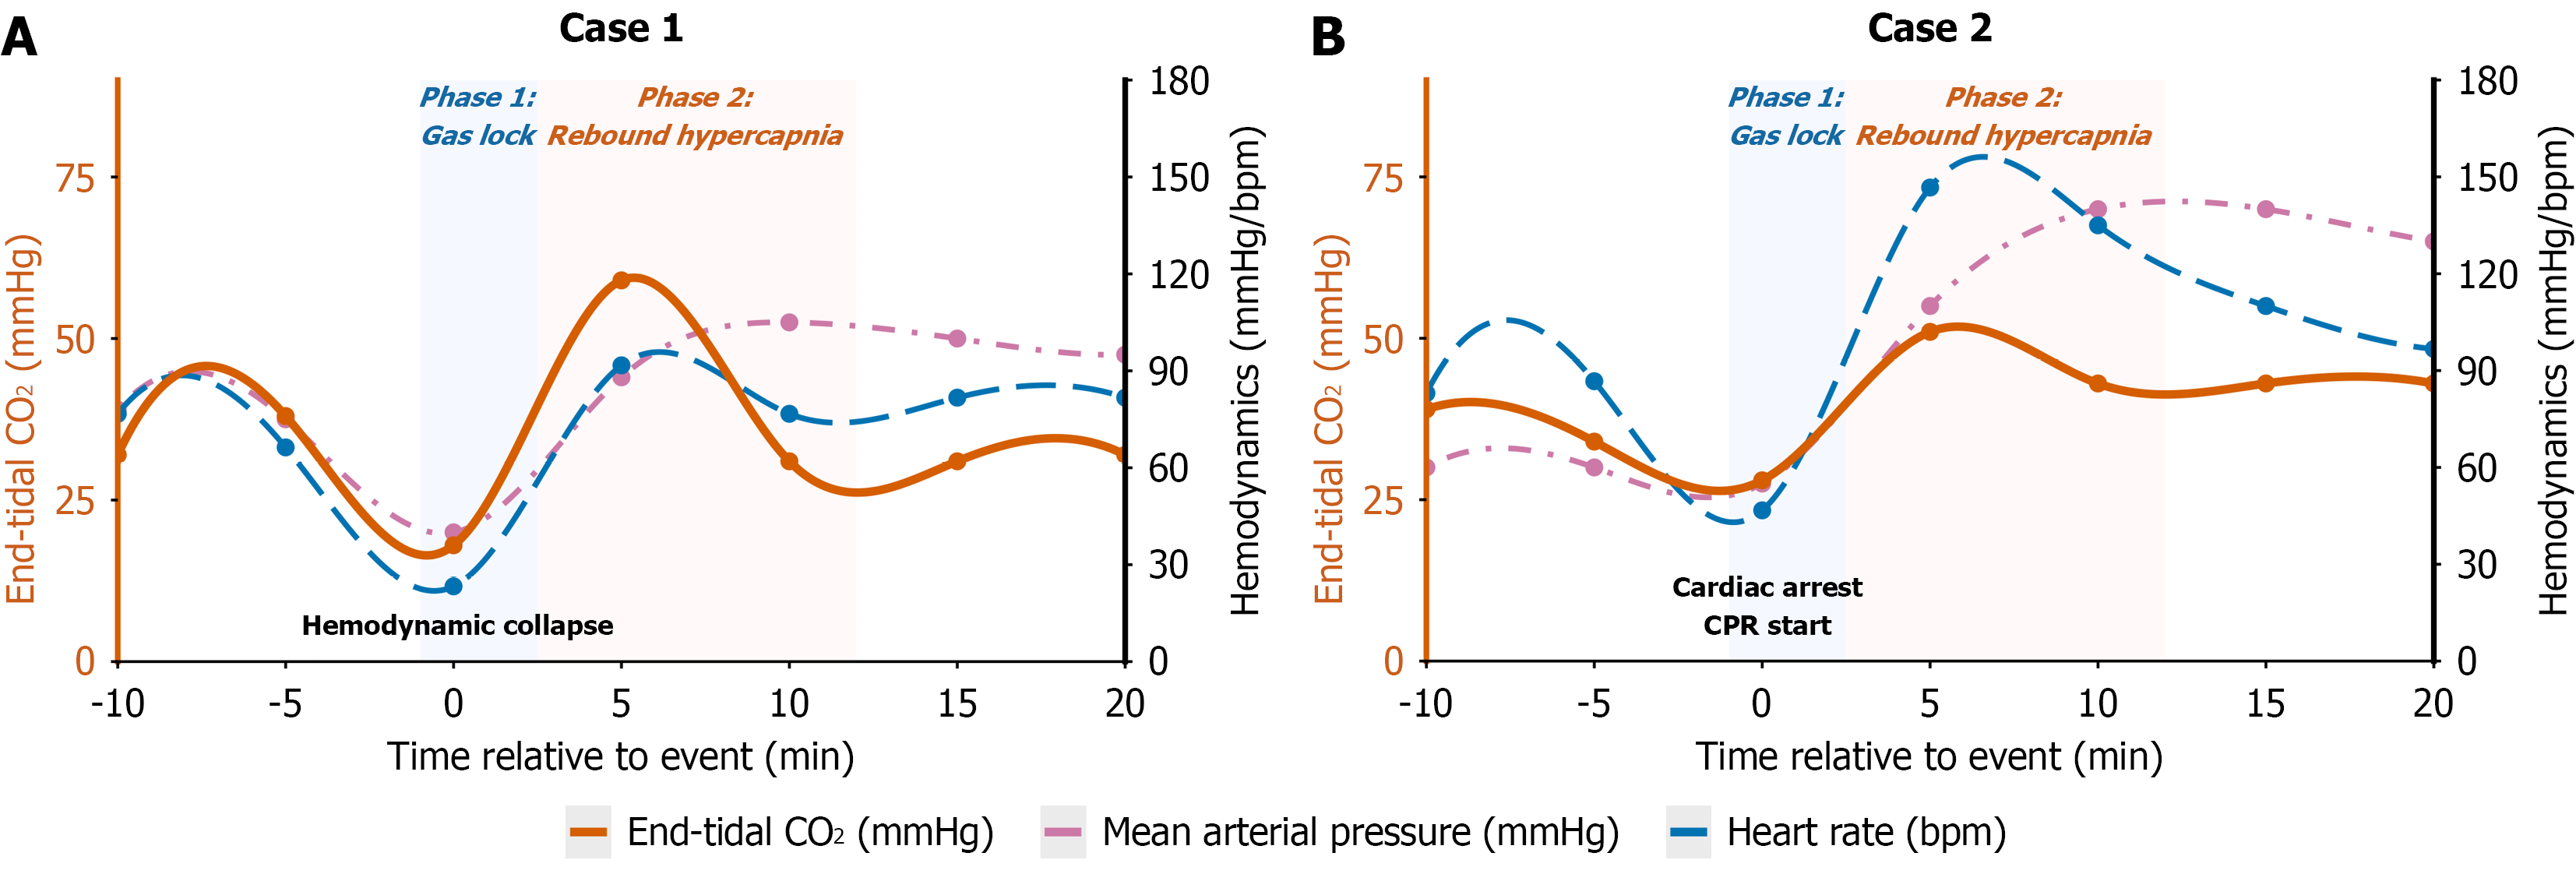
Figure 1 Perioperative hemodynamic and capnographic trends that demonstrate the biphasic signature of carbon dioxide embolism.
A: Case 1: The graph depicts the sequence of events surrounding the transient hemodynamic collapse. Phase 1 (“gas lock”) was characterized by the precipitous drop in end-tidal carbon dioxide (ETCO2, orange solid line) coincident with the significant decline in mean arterial pressure (blue dashed line) and heart rate (pink dash-dot line). Phase 2 (“rebound hypercapnia”) was manifested during resuscitation as a paradoxical surge in ETCO2 (> 50 mmHg) due to the washout of dissolved carbon dioxide; B: Case 2: The graph illustrates the event that progressed to cardiac arrest, and the subsequent cardiopulmonary resuscitation (CPR). The values shown represent the last recorded measurements immediately prior to CPR initiation. A similar biphasic pattern was observed: An initial drop in ETCO2 during the gas lock phase, followed by the rebound hypercapnia upon return of spontaneous circulation. CPR: Cardiopulmonary resuscitation; CO2: Carbon dioxide.
- Citation: Li CP, Lv YM. Carbon dioxide embolism during salvage transanal total mesorectal excision in “frozen pelvis”: Two case reports. World J Gastrointest Surg 2026; 18(7): 119733
- URL: https://www.wjgnet.com/1948-9366/full/v18/i7/119733.htm
- DOI: https://dx.doi.org/10.4240/wjgs.v18.i7.119733