
















Copyright: ©Author(s) 2026.
World J Gastrointest Surg. Jun 27, 2026; 18(6): 118979
Published online Jun 27, 2026. doi: 10.4240/wjgs.118979
Published online Jun 27, 2026. doi: 10.4240/wjgs.118979
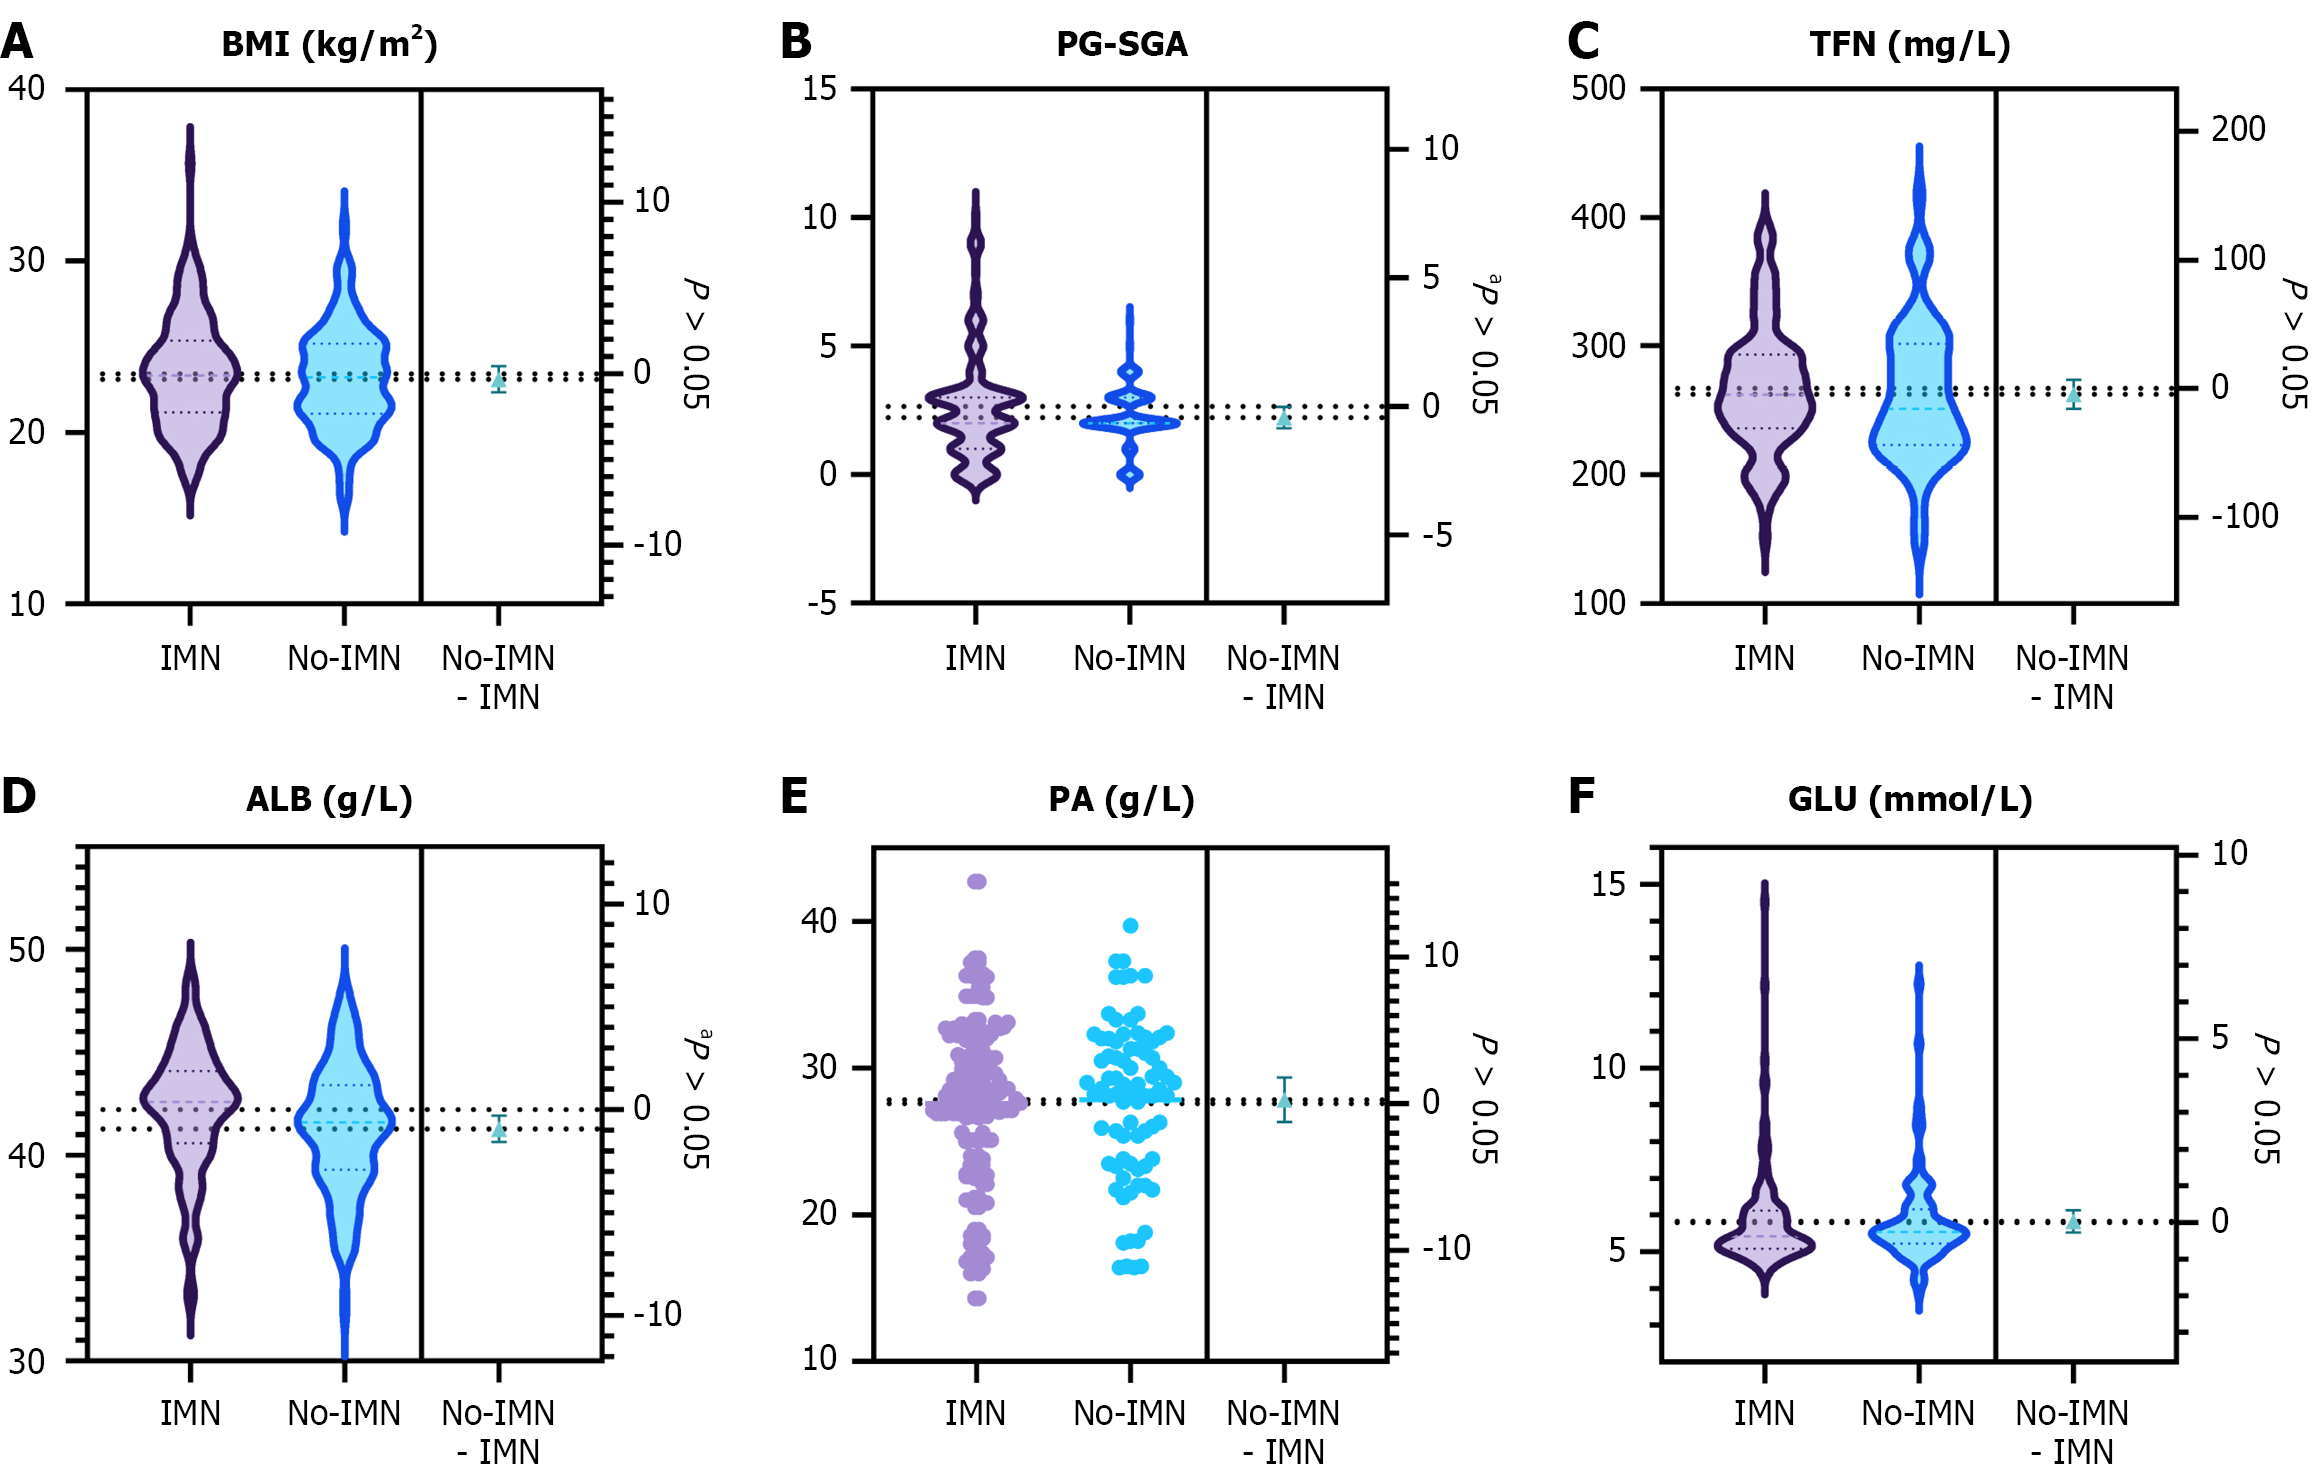
Figure 2 Comparison of nutritional parameters between the two groups after the intervention.
A: The body mass index in both groups were not comparable (P > 0.05); B: Patient-Generated Subjective Global Assessment scores were significantly lower in the immunonutrition group than in the control group (aP = 0.031); C: The serum transferrin concentration in both groups were not comparable (P > 0.05); D: Compared to the immunonutrition group, the serum albumin concentration was significantly greater than that in the control group (aP = 0.004); E: The serum prealbumin concentration in both groups were not comparable (P > 0.05); F: The blood glucose concentration in both groups were not comparable (P > 0.05). BMI: Body mass index; PG-SGA: Patient-Generated Subjective Global Assessment; TFN: Transferrin; ALB: Albumin; PA: Prealbumin; GLU: Glucose; IMN: Immunonutrition.
- Citation: Bao MD, Huang F, Cheng P, Zheng ZX. Effects of long-term immunonutrition on postdischarge colorectal cancer surgery patients. World J Gastrointest Surg 2026; 18(6): 118979
- URL: https://www.wjgnet.com/1948-9366/full/v18/i6/118979.htm
- DOI: https://dx.doi.org/10.4240/wjgs.118979