
















Copyright: ©Author(s) 2026.
World J Gastrointest Surg. May 27, 2026; 18(5): 119504
Published online May 27, 2026. doi: 10.4240/wjgs.v18.i5.119504
Published online May 27, 2026. doi: 10.4240/wjgs.v18.i5.119504
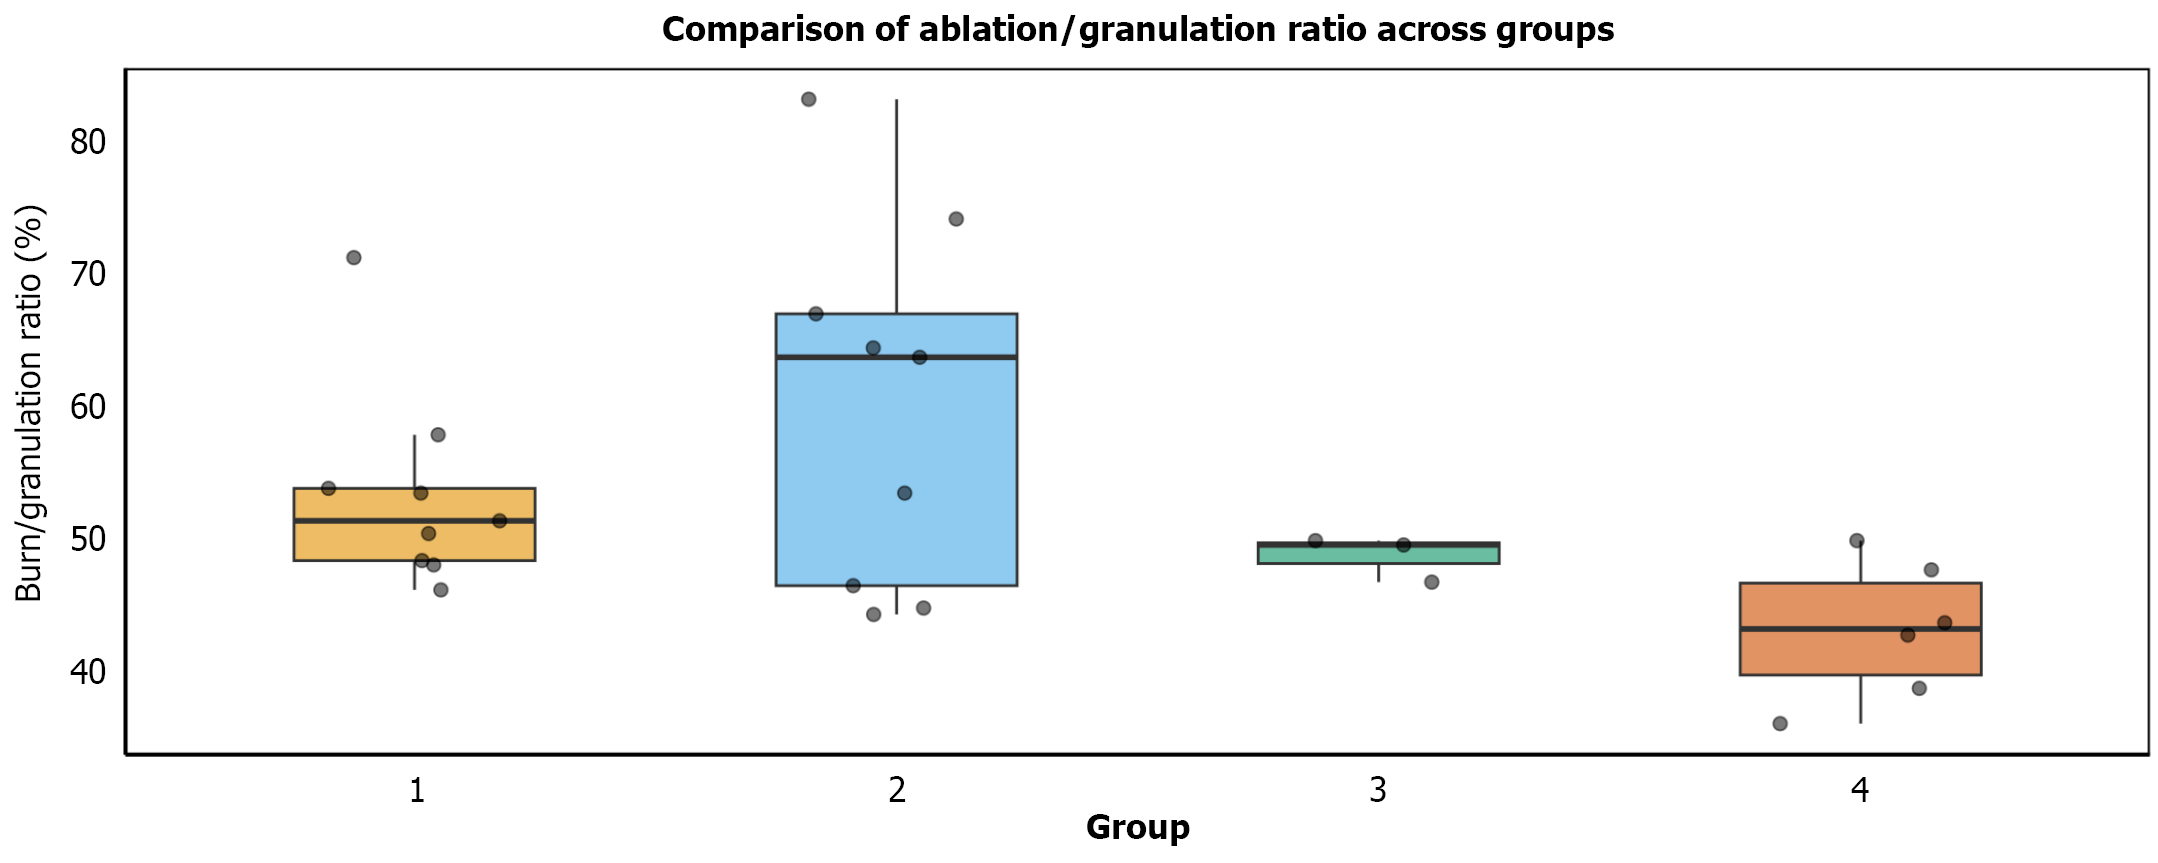
Figure 4 Box plot illustrating the ablation-to-granulation tissue area ratios across the four experimental groups.
Group 2 (120 °C for 24 seconds) exhibited the highest ablation/granulation ratios. Group 2 was significantly higher than groups 1, 3, and 4 by Tukey’s honestly significant difference post hoc test (all P < 0.001).
- Citation: Yoon S, Ji WB, Um JW, Hong KD. Optimizing radiofrequency ablation parameters for perianal fistula treatment: A porcine model study. World J Gastrointest Surg 2026; 18(5): 119504
- URL: https://www.wjgnet.com/1948-9366/full/v18/i5/119504.htm
- DOI: https://dx.doi.org/10.4240/wjgs.v18.i5.119504