
















Copyright: ©Author(s) 2026.
World J Gastrointest Surg. May 27, 2026; 18(5): 119310
Published online May 27, 2026. doi: 10.4240/wjgs.v18.i5.119310
Published online May 27, 2026. doi: 10.4240/wjgs.v18.i5.119310
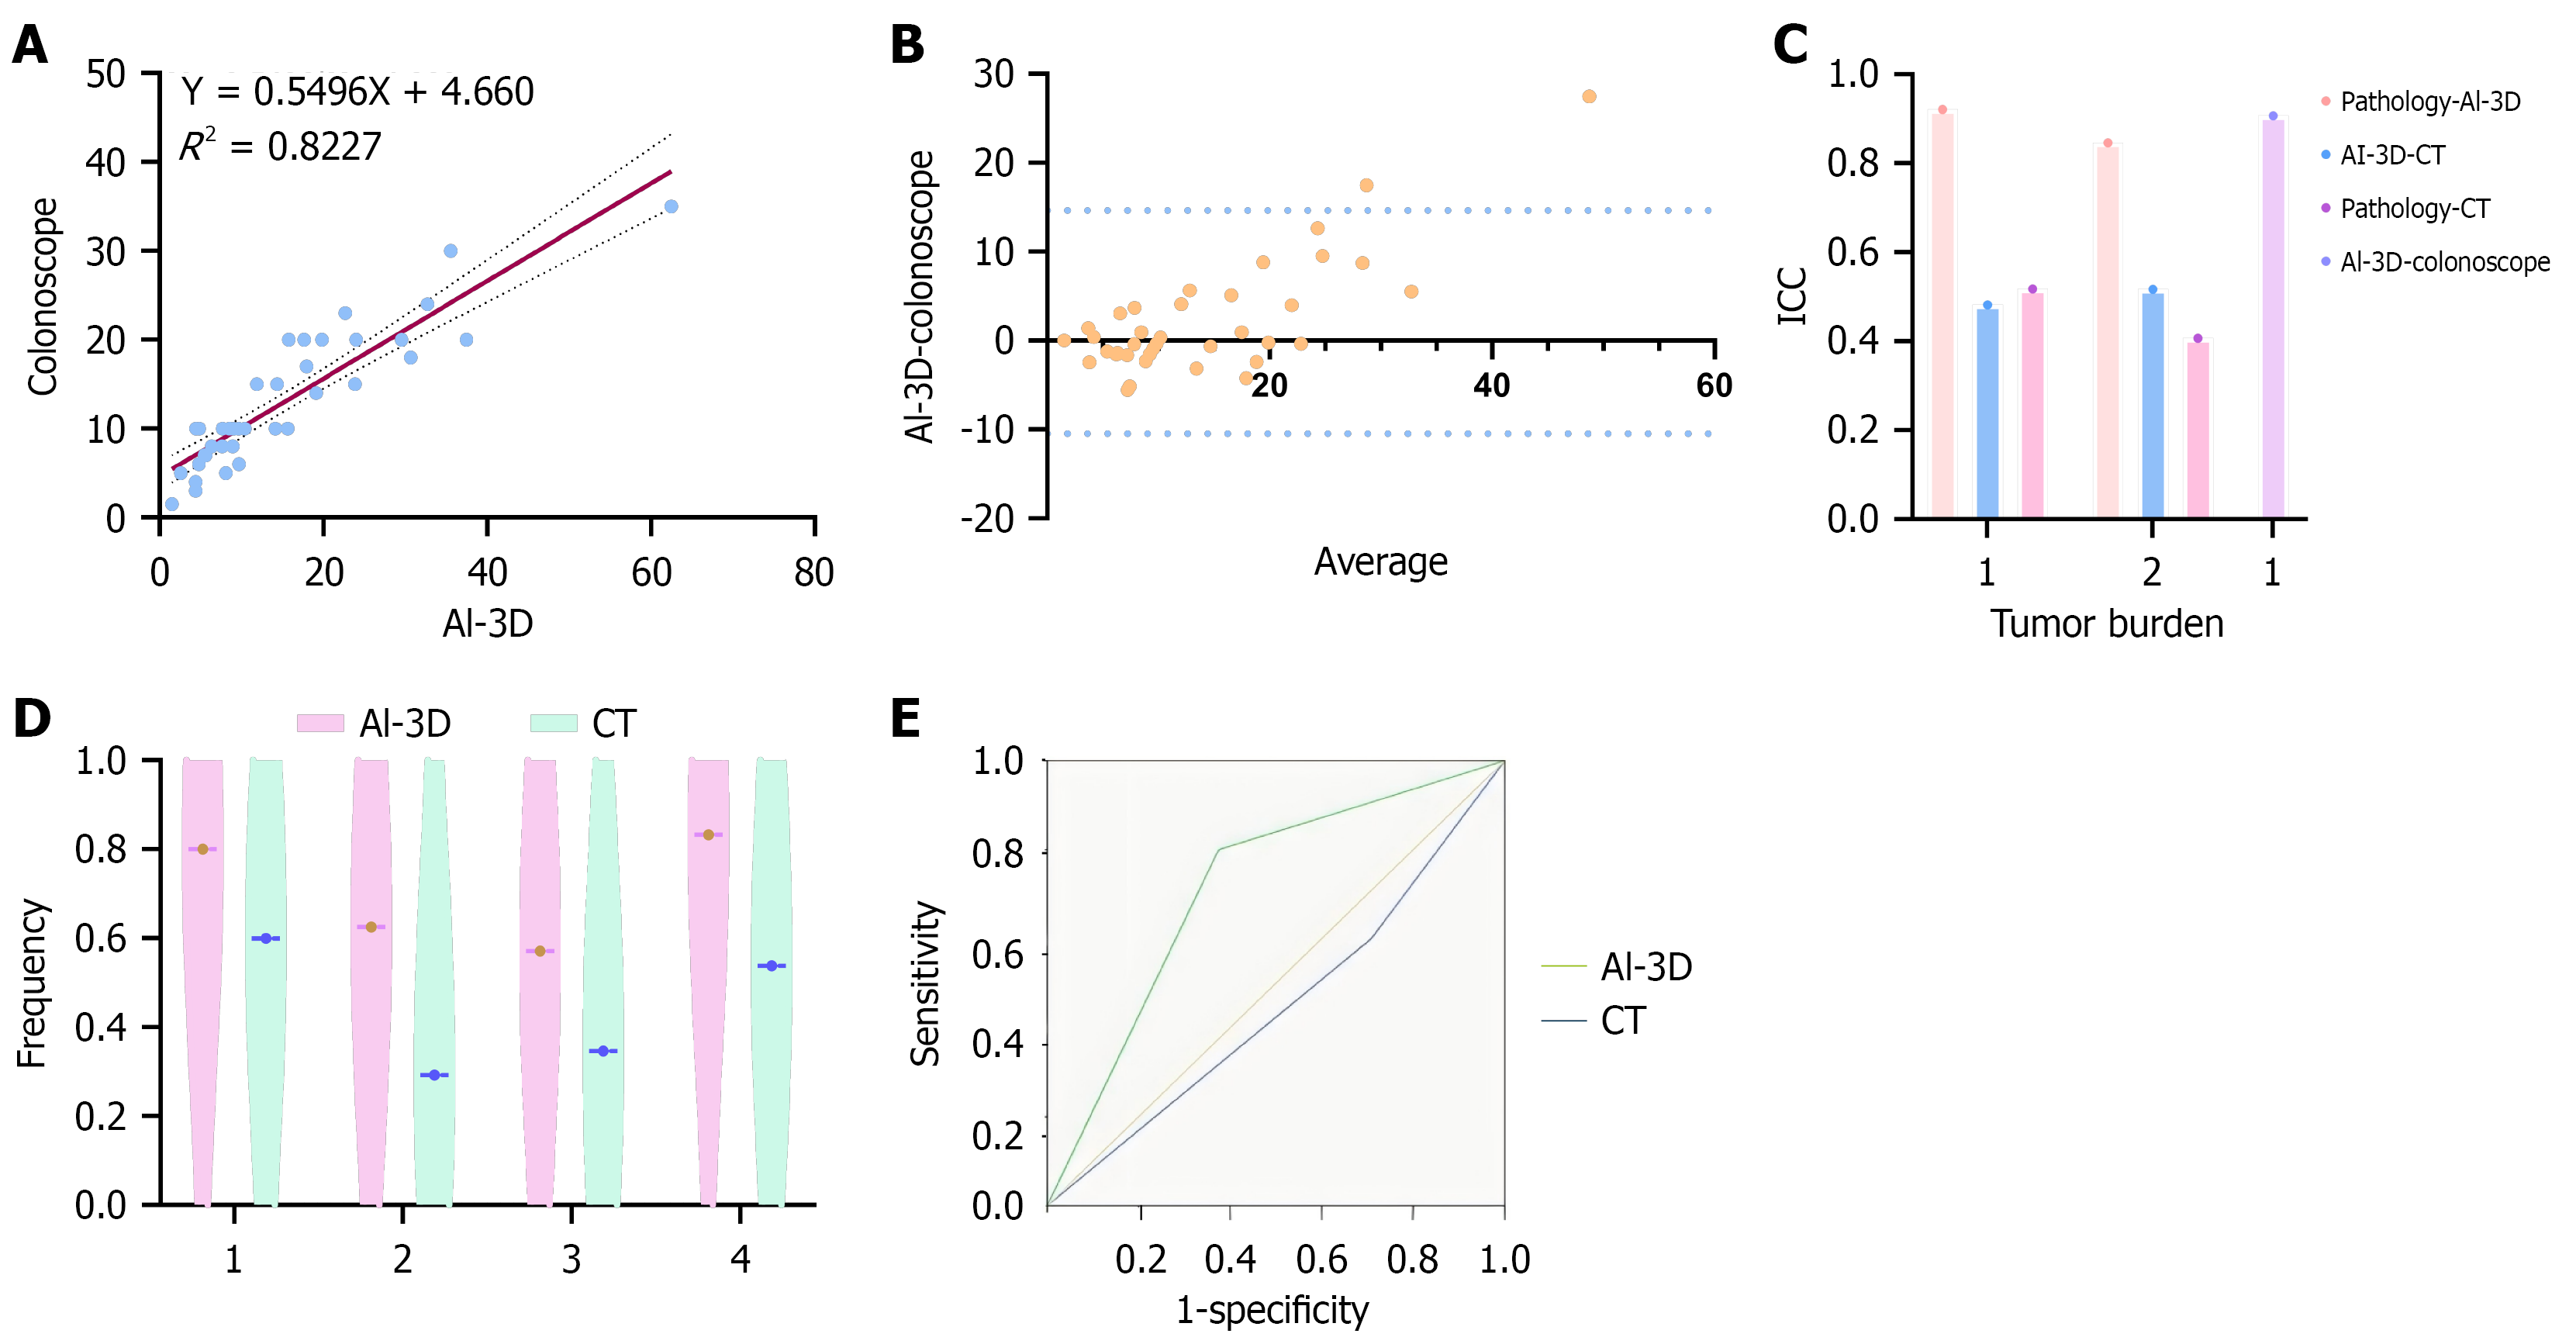
Figure 7 Evaluation of the distance from the tumor's lowest border to the anal verge and lymph node involvement using artificial intelligence-driven digital three-dimensional imaging compared with colonoscopy and computed tomography.
A and B: Bland-Altman plot and Scatter plot of agreement between measurements from artificial intelligence-driven digital three-dimensional imaging (AI-3D digital imaging) and colonoscopy; C: Intraclass correlation coefficient cluster diagram (1: The maximum tumor diameter; 2: The maximum tumor cross-sectional area; 3: Distance from the tumor’s lowest border to the anal verge); D: Predictive evaluation of lymph node involvement using AI-3D and computed tomography (1: Sensitivity; 2: Specificity; 3: Positive predictive value; 4: Negative predictive value); E: Receiver operating characteristic curves of the two techniques. AI-3D: Artificial intelligence-driven digital three-dimensional imaging; CT: Computed tomography.
- Citation: Wei JM, Chen SX, He T, Wang JF. Application of artificial intelligence-driven three-dimensional imaging in preoperative planning for rectosigmoid colon cancer. World J Gastrointest Surg 2026; 18(5): 119310
- URL: https://www.wjgnet.com/1948-9366/full/v18/i5/119310.htm
- DOI: https://dx.doi.org/10.4240/wjgs.v18.i5.119310