
















Copyright: ©Author(s) 2026.
World J Gastrointest Surg. May 27, 2026; 18(5): 118468
Published online May 27, 2026. doi: 10.4240/wjgs.v18.i5.118468
Published online May 27, 2026. doi: 10.4240/wjgs.v18.i5.118468
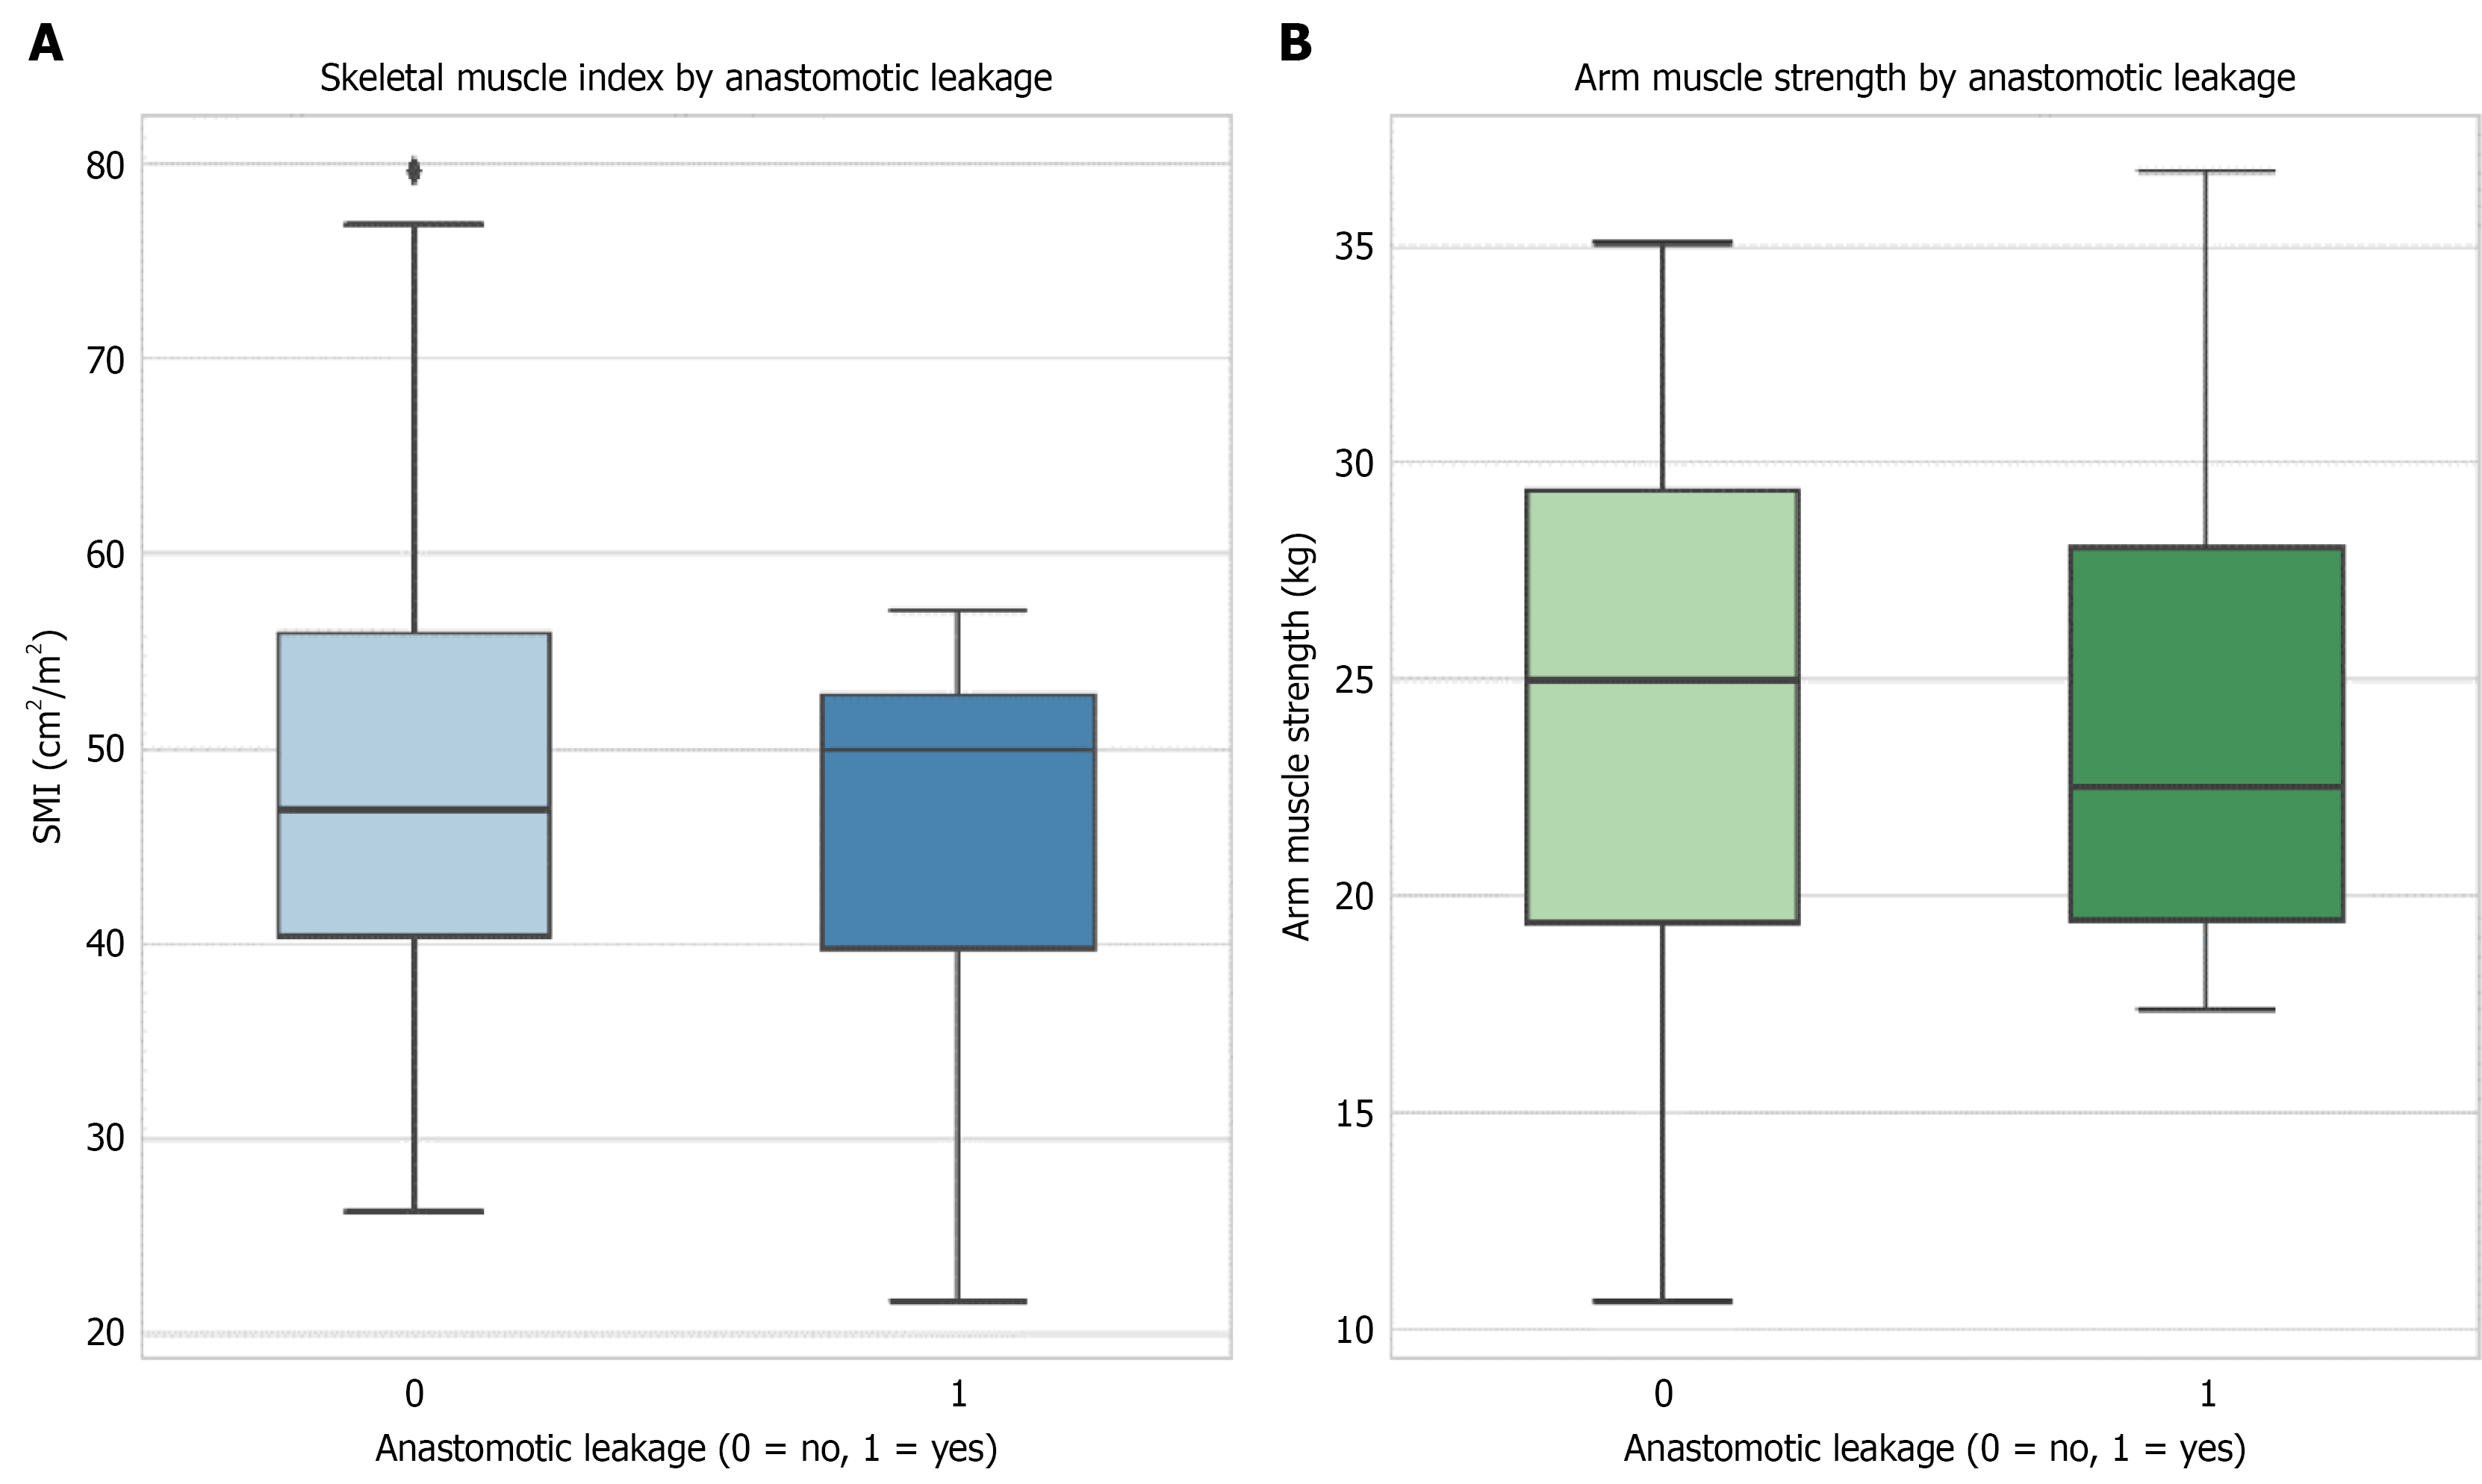
Figure 3 Box-and-whisker plots demonstrating the distribution of skeletal muscle index and handgrip strength according to anastomotic leakage status.
A: Patients who developed anastomotic leakage (n = 103) exhibited significantly lower skeletal mass index (cm2/m2) values (P = 0.03) compared with those without anastomotic leakage (n = 14); B: Patients who developed anastomotic leakage (n = 103) exhibited reduced handgrip strength (kg; P < 0.001) compared with those without anastomotic leakage (n = 14). SMI: Skeletal mass index.
- Citation: Gökdere OG, Öndeş B, Kanat BH, Ünlü S. Weak grip, weak anastomosis? Handgrip strength and sarcopenia as predictors of anastomotic leakage after colorectal cancer surgery. World J Gastrointest Surg 2026; 18(5): 118468
- URL: https://www.wjgnet.com/1948-9366/full/v18/i5/118468.htm
- DOI: https://dx.doi.org/10.4240/wjgs.v18.i5.118468