
















Copyright: ©Author(s) 2026.
World J Gastrointest Surg. May 27, 2026; 18(5): 116545
Published online May 27, 2026. doi: 10.4240/wjgs.v18.i5.116545
Published online May 27, 2026. doi: 10.4240/wjgs.v18.i5.116545
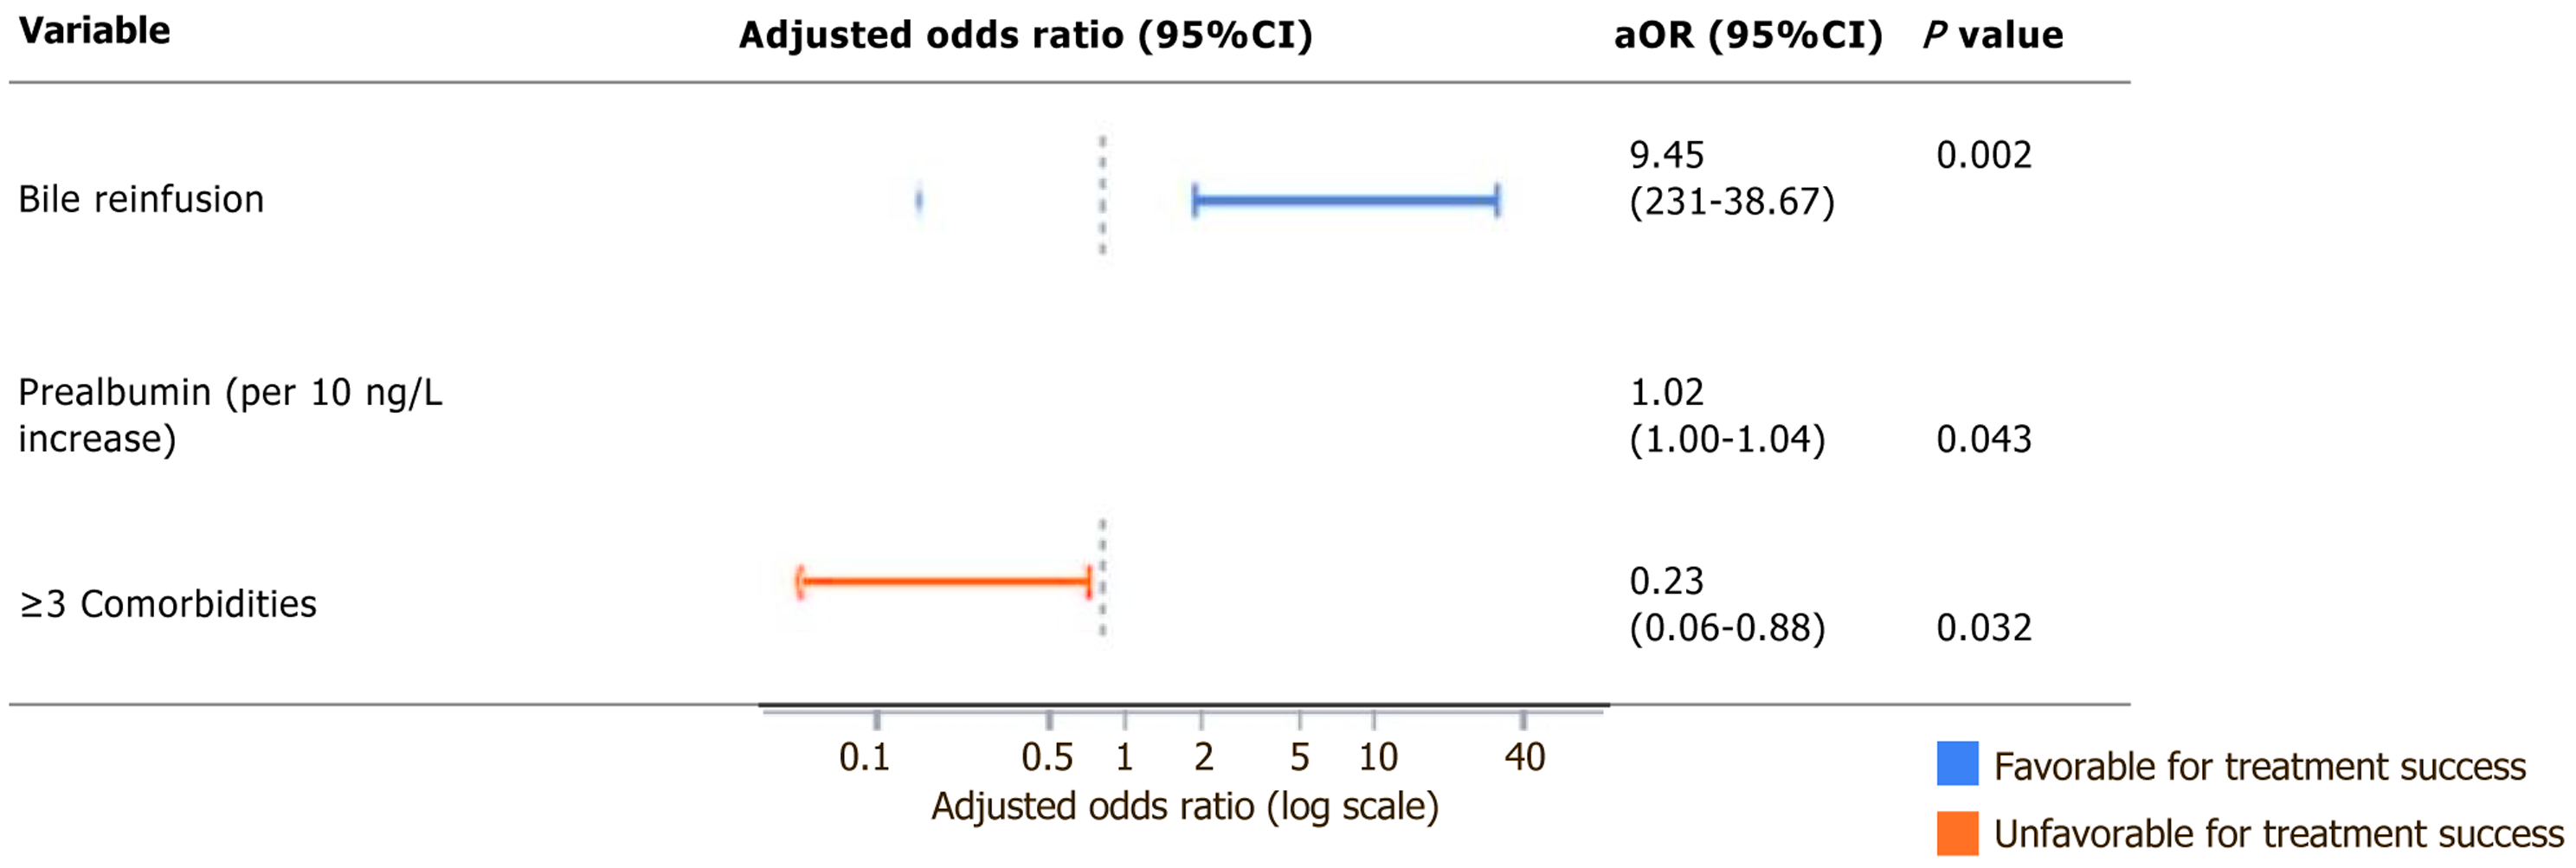
Figure 3 Forest plot showing adjusted odds ratios for factors associated with treatment success.
The plot displays three variables and their relationship with treatment outcomes. Bile reinfusion [adjusted odds ratio (aOR) = 9.45, 95% confidence interval (CI): 2.31-38.67, P = 0.002] and prealbumin per 10 mg/dL increase (aOR = 1.02, 95%CI: 1.00-1.04, P = 0.043) were associated with favorable treatment success (shown in blue), while having ≥ 3 comorbidities (aOR = 0.23, 95%CI: 0.06-0.88, P = 0.032) was associated with unfavorable treatment success (shown in orange). The x-axis presents adjusted ORs on a logarithmic scale, with the vertical dashed line at 1.0 representing no effect. Error bars indicate 95%CIs. aOR: Adjusted odds ratio; CI: Confidence interval.
- Citation: Wang Y, Xi JW, Zhang WS, Cao ZL, Liu B, Zhao YN, Chen Y. Self-made double-lumen jejunal tube for bile reinfusion and enteral nutrition after percutaneous transhepatic cholangial drainage. World J Gastrointest Surg 2026; 18(5): 116545
- URL: https://www.wjgnet.com/1948-9366/full/v18/i5/116545.htm
- DOI: https://dx.doi.org/10.4240/wjgs.v18.i5.116545